Maps
Browse through maps depicting Bay health and restoration, including pollution trends, public access sites and more.
Chemical Contaminants (2020)
Date created: June 5, 2023Tidal waters that are impaired for part or all of the indicated Bay segment by toxic chemicals based on each state's implementation of the Clean Water Act.
View map
Congressional Districts in the Chesapeake Bay Watershed (118th Congress)
Date created: May 2, 2023This map shows the complete or partial Congressional Districts that make up the area of the Chesapeake Bay basin. The current senators and congressional members of the 118th Congress who have districts within the borders of the basin are listed by state.
View map
Chemical Contaminants (2018)
Date created: February 8, 2022Tidal waters that are impaired for part or all of the indicated Bay segment by toxic chemicals based on each state's implementation of the Clean Water Act.
View map
Chesapeake Bay Mean Surface Salinity (1985-2018)
Date created: October 10, 2019The salinity of the waters in the Chesapeake Bay and its tidal tributaries varies from season to season and year to year depending largely on the amount of freshwater flowing into the Bay. The salinity of these tidal waters has an effect on such things as fish spawning habitat, underwater grass species distribution, oyster distribution and the likely distribution of the oyster-killing parasites Dermo and MSX.
View map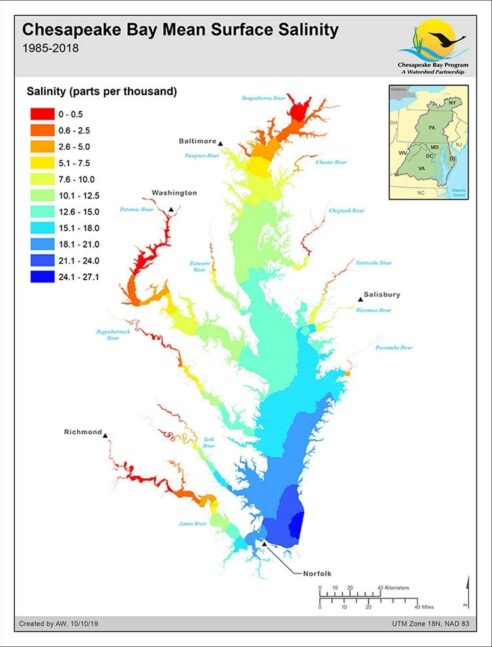
Chemical Contaminants (2014)
Date created: November 8, 2017Tidal waters that are impaired for part or all of the indicated Bay segment by toxic chemicals based on each state's implementation of the Clean Water Act.
View map
Shad Abundance (2015)
Date created: May 16, 2016American shad were once the most abundant and economically important species in the Chesapeake Bay. Shad are anadromous fish and spend most of their lives in the ocean, returning to freshwater rivers to spawn after they reach maturity. Data for the York, Potomac, Rappahannock and lower James Rivers were provided by the Virginia Institute of Marine Science via an ongoing Catch per Unit Effort (CPUE) study involving American Shad gill-netting. Data for the Susquehanna and upper James Rivers represent published fishway passage values for Conowingo and Boshers Dams, respectively.
View map
Benthic Habitat (Index of Biological Integrity) (2014) Annual Average Score by Sampling Station
Date created: July 2, 2015This map shows the 2014 indicator status of the Benthic Index of Biological Integrity by station.
View map
Benthic Habitat (Index of Biological Integrity) (2013) Annual Average Score by Sampling Station
Date created: July 2, 2015This map shows the 2013 indicator status of the Benthic Index of Biological Integrity by station.
View map
Benthic Habitat (Index of Biological Integrity) (2014) Percent of Goal Achieved
Date created: July 2, 2015This map shows the percent of the Index of Biological Integrity indicator goal achieved by segment.
View map
Benthic Habitat (Index of Biological Integrity) (2013) Percent of Goal Achieved
Date created: July 2, 2015This map shows the percent of the Index of Biological Integrity indicator goal achieved by segment.
View map