Maps
Browse through maps depicting Bay health and restoration, including pollution trends, public access sites and more.
Long-Term Trends for Secchi Disc Depth in the Chesapeake Bay: 1999-2013
Date created: April 30, 2015Long-term trends were computed by state partners using the Seasonal Kendall non-parametric technique for annual data collected from 1999-2013. Highly significant trends are indicated with triangles and possible trends are show with colored circles. Secchi Disk Depth observations (a measure of water clarity) are increasing/improving significantly at 2 stations, possibly increasing at 2 stations, decreasing/degrading significantly at 28 stations, and possibly decreasing at 14 stations.
View map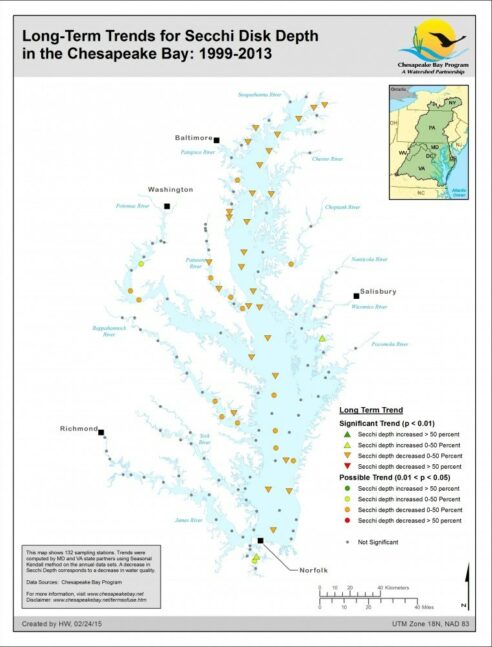
Mid-Channel Water Clarity (2011)
Date created: May 10, 2012This map shows the percent of the Water Clarity goal achieved for each Chesapeake Bay Segment in 2011.
View map
Mid-Channel Water Clarity (2010)
Date created: March 25, 2011This map shows the percent of the Water Clarity goal achieved for each Chesapeake Bay Segment in 2010.
View map
Mid-Channel Water Clarity (2009)
Date created: March 5, 2010This map shows the percent of the Water Clarity goal achieved for each Chesapeake Bay Segment in 2009.
View map
Mid-Channel Water Clarity (2008)
Date created: March 9, 2009This map shows the percent of the Water Clarity goal achieved for each Chesapeake Bay Segment in 2008.
View map
Chesapeake Bay Segmentation Scheme (For 303d listing - 92 segments)
Date created: June 4, 2008The 92-segment scheme for the Chesapeake Bay and its tidal tributaries used for dissolved oxygen and water clarity assessments in the most recent 303d/305b listing efforts of the four Bay tidal jurisdictions is documented here. The 92-segment scheme was derived from 1) the 2003 published 78-segment scheme with the addition of jurisdictional boundary lines imposed to create 89-segments, then 2) additionally includes only split segments agreed upon for the tidal James and Potomac rivers.
View map
Mid-Channel Water Clarity (2007)
Date created: March 24, 2008This map shows the percent passing of the Water Clarity goals for each Chesapeake Bay Segment in 2007.
View map