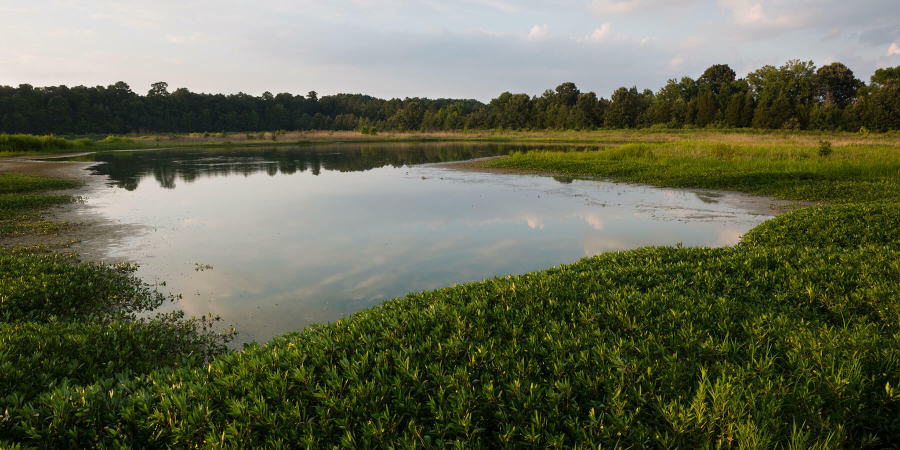
Resource Lands Assessment
The Resource Lands Assessment (RLA) uses GIS models and expert knowledge to provide a regional, multi-state look at the most important remaining resource lands in the Chesapeake Bay watershed.
The Resource Lands Assessment (RLA) provides a regional, multi-state look at the most important remaining resource lands in the Chesapeake Bay watershed. Geographic Information Systems (GIS) models and expert knowledge help assess the value of resource lands within the watershed to: provide guidance to state and local governments in their land protection strategies, serve as a resource for the land trust community, suggest conservation focus areas to complement watershed restoration plans and identify areas important to the forest products industry.
Approach
The Bay Program developed analytical approaches for assessing the value of forests, farms and wetlands within the Chesapeake watershed using GIS models to manipulate and combine data from a variety of sources. The resulting assessment models can be utilized individually or in combination. The composite data sets can be reclassified and applied at different geographic scales based on the needs of the user.
Methods
Each of the six assessment models uses a series of GIS data layers that were selected to represent ecological, cultural or socio-economic phenomena. Data layers were selected based on their importance in assigning value to the landscape and weighted using input from resource experts within and outside of the Bay Program. Each assessment model contains different assumptions for appropriate data, the use of weights and the limitations regarding display and interpretation of the composite results. Below is additional information on the methods employed, maps and data used for each assessment model.
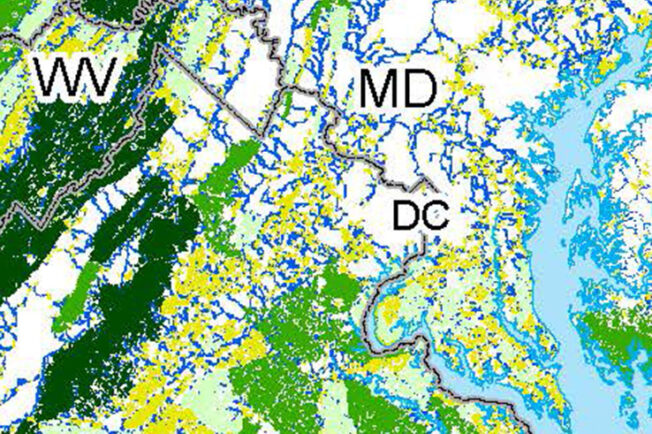
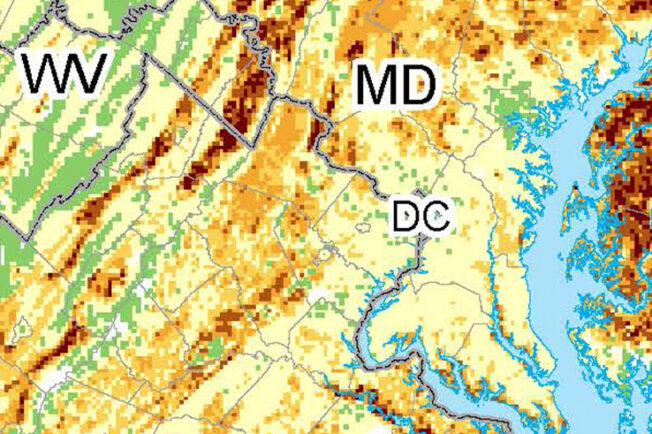
Ecological Network Model
The Ecological Network Assessment aims to identify the most important remaining habitats in the Virginia, Maryland, Pennsylvania, West Virginia, Delaware and D.C. portions of the Bay watershed. The assessment applies a “hubs and corridors” approach, which is based on principles of landscape ecology and conservation biology, that suggest that size and connectivity are critical factors of high integrity habitat.
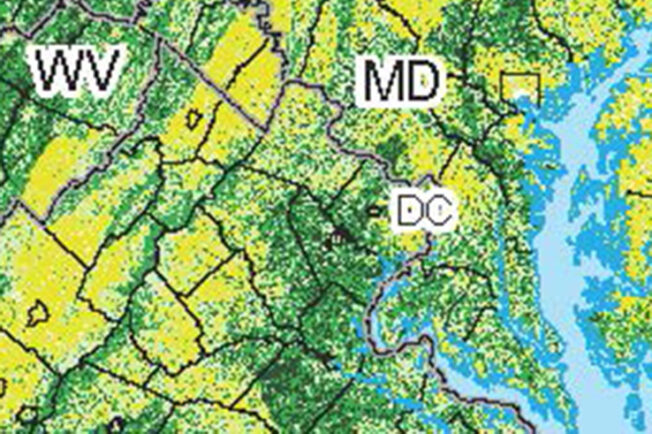
Water Quality Protection Model
The Water Quality model aims to identify forests and wetlands important in protecting water quality and sustaining watershed integrity. This “watershed value” is based on physical and biological functions that store precipitation, retain and assimilate nutrients, moderate runoff, protect soils and maintain important critical landscape functions such as those of riparian buffers.
Forest Economics Model
The identification of economically important forest lands focuses on the potential for future economic benefits associated with timber management activities. This considers not only the potential economic gain from forest harvest operations, but also the long-term economic sustainability of forest management and the local importance of the timber and wood products industry.
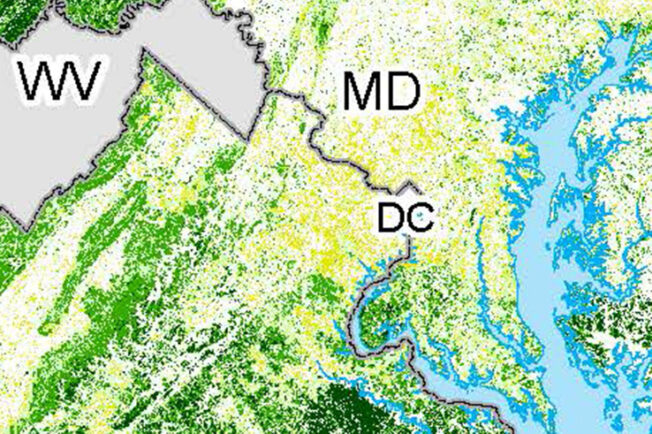
Prime Farmland Model
Assessing the extent of farming on prime soils in the Bay watershed is a useful measure for determining the lands of highest importance for agricultural productivity and sustainability. Areas of intense agricultural activity on prime soils can be overlaid with maps of development pressure to prioritize agricultural preservation activities.
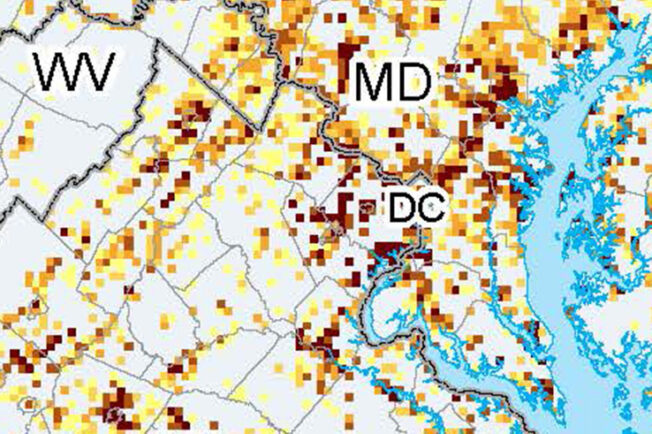
Cultural Assessment Model
Growth and development not only threaten lands of high value for water quality and habitat, but also cultural lands that directly connect many citizens in the Bay watershed to the land. Important in preserving heritage and traditional values, cultural lands often define a sense of place. The objective of the cultural assessment is to identify lands that provide historic and archaeological assets and further inform preservation efforts.
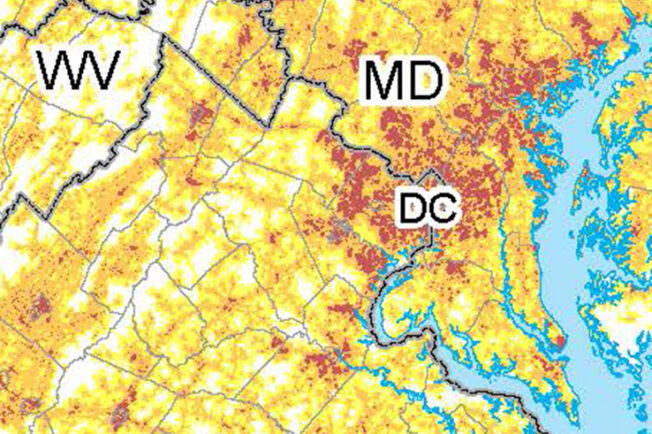
Vulnerability Model
The vulnerability layer evaluates the relative potential risk of future land conversion to urban uses. Vulnerability is defined as a function of suitability for development and proximity to growth “hot spots.” The vulnerability layer is useful as a stand-alone layer to evaluate development trends, but can also be combined with the other RLA layers to prioritize land conservation efforts.
Data
The RLA methodology utilized a wide variety of existing data from federal and state-specific sources. Example data sets included:
- Land Cover
- Hydrography
- Wetlands
- Roads, Railroads and Power lines
- Protected Lands
- Rare Species Locations (Except PA)
- Watershed Boundaries
- Acid Mine Drainage
- Ecoregions
- Vegetation
- Potential Habitat Distribution
- Soils
- Elevation, Aspect and Slope
- Forest Fragmentation Metrics
- Hydrogeomorphic Regions
- Floodplains
- Imperviousness
- Water Quality
- Drinking Water Supplies
- Precipitation
- Human Population (Census)
- Property Ownership
- Historic Timber Harvests
- Resource-Based Economic Data
- Public and Private Land Designations
- Mill Locations
- National Historic Landmarks
- National Register Historic Districts and Sites
- State Inventories of Historic Sites
- Archaeological Sites