
Natural events that shaped the health of the Chesapeake Bay
How tropical storms and multi-year droughts have affected water quality scores
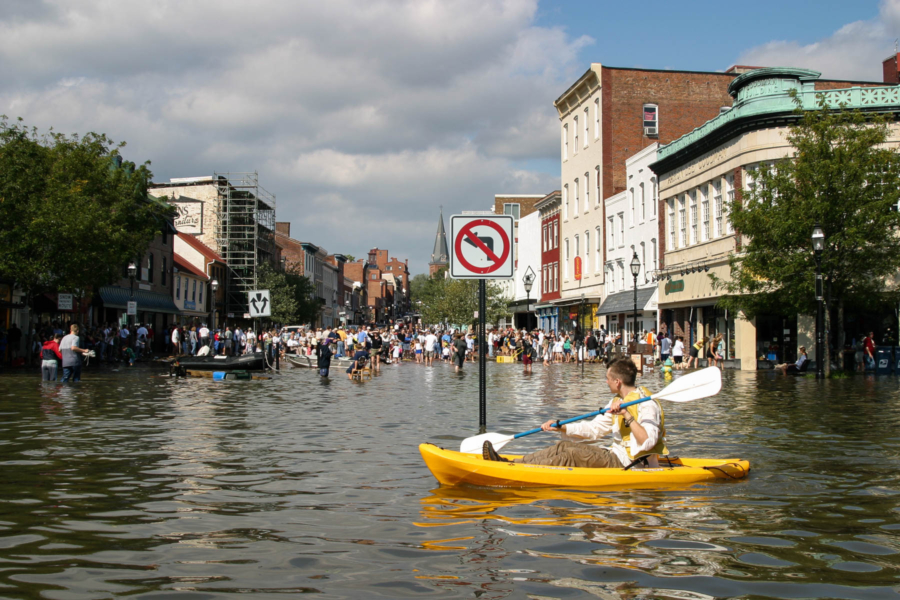
In June 1972, Tropical Storm Agnes charged up from the Gulf of Mexico and covered the Mid-Atlantic in heavy winds and rain for two full days. Communities across the region saw catastrophic floods that destroyed homes, displaced families and caused 50 deaths in Pennsylvania alone.
In addition to the devastation experienced by local communities, Agnes also dealt blows to the health of the Chesapeake Bay. Severely flooded rivers washed unimaginable amounts of nutrients and sediments into the estuary, suffocating oyster reefs and underwater grass beds at the peak of their growing season. The Bay was already struggling at the time, but after Agnes, appeared to be on the verge of collapse.
By 1983, the Chesapeake Bay Program formed and began officially documenting water quality in the estuary, while leading its recovery. Looking at the partnership’s 40+ years of data, we can see how natural events like tropical storms—as well as droughts and the natural growth cycle of Bay plants—have shaped the health of the estuary.
Estimating water quality
Each year, the Chesapeake Bay Program provides an update on the Bay’s water quality. Researchers estimate the percentage of the Bay that met water quality standards across a three-year timeline, such as 2021-2023 or 2022-2024. Our research partners measure dissolved oxygen, water clarity and chlorophyll-a (algae) at hundreds of locations and then use statistical models to estimate water quality throughout the whole estuary.
A timeline of data that goes back to 1985 helps us see how the Bay’s water quality has risen and fallen. Numerous factors affect the Bay's water quality, such as population increases, land development, agricultural activities and conservation practices. However, weathers patterns—in particular, large storms and prolonged droughts—also play a role in shaping water-quality conditions.
Storms in the Bay
During the 1980s and 1990s, the Bay saw steady improvement thanks to both a burgeoning recovery effort and a lack of severe storms. But in 2003, Hurricane Isabel swept through the region and derailed years of progress.
Underwater grasses crashed by about 26,000 acres from 2002 to 2003, and the Bay’s water quality worsened for four straight assessment periods. During the 2004-2006 assessment period, just 32.4% of the Bay met water quality standards.
For about another decade, the Bay recovered, with water quality improving almost every year and hitting a peak of 39.5% during the 2008-2010 assessment period.
Then came yet another hurricane—and tropical storm.
In late August of 2011, Hurricane Irene saturated soils and pushed high storm surges into the Bay. Less than two weeks later, the remnants of Tropical Storm Lee stalled over the region and dropped historic rainfall on the already soaked watershed.
This back-to-back sequence dramatically lowered salinity levels across the upper Bay and buried critical underwater grass beds in silt. Looking at the data, we see that the Bay’s water quality declined several years in a row after this event, and hit a low of 27.6% during the 2011-2013 assessment period.
Droughts in the Bay
While storms can worsen water quality, below average rainfall or droughts typically lead to less runoff flowing from the watershed and into the Bay.
We see this during the early 2000s, when a multi-year drought from 1998 to 2002 helped water quality scores rise. According to USGS, average streamflow into the Bay in 2000 dropped to 59% of the long-term average—with the Potomac River flow near Washington, D.C. falling 65% below normal.
Without heavy runoff clouding the water or excess nutrients fueling dead zones, water clarity and dissolved oxygen improved significantly, culminating in a major surge of underwater grass growth across the estuary.
During the 2000-2002 assessment period—just before the arrival of Hurricane Agnes—an estimated 37.2% of the Bay met water quality standards. You can see similar patterns in recent years, where below average rainfall lowers nutrient runoff, resulting in a rise in underwater grass and dissolved oxygen levels.
Boom and bust of underwater grass
Another natural event that the Bay Program’s data highlights is the natural growth cycle of underwater grass.
For example, during the 2015-2017 assessment period, the Bay reached its highest water quality score ever, due in part to the explosive growth of underwater grass. During that period, an estimated 42.2% of the estuary met water quality standards—the Bay’s best score to date.
However, a large portion of that growth was due to increases in widgeon grass, a species with a notorious “boom and bust” cycle.
In 2018, the Bay’s underwater grass dropped from one of its highest levels to one of the lowest in years. Since the abundance of underwater grass helps determine water quality, the Bay’s overall water quality score dropped with it. In fact, scores went down for four straight assessment periods and hit a low of 28.1% during 2019-2021.
This period of underwater grass declines was made even worse by—you guessed it—years of unusually high rainfall.
What’s on the horizon?
All of these data can make it seem like the health of the Bay is out of our control, which couldn’t be further from the truth! Chesapeake Bay Program partners are constantly implementing pollutant reduction practices that help control nutrient and sediment runoff and improve water quality, no matter the weather.
Additionally, storms and droughts are just a piece of the puzzle. Land development, population growth, temperature—even disease and invasive species—can impact conditions in the Chesapeake Bay.
The next time you hear of a storm rolling through your community, consider what this might do to your local stream and river, and ultimately the Bay.
Comments
There are no comments.
Thank you!
Your comment has been received. Before it can be published, the comment will be reviewed by our team to ensure it adheres with our rules of engagement.
Back to recent stories