Maps
Browse through maps depicting Bay health and restoration, including pollution trends, public access sites and more.
Chemical Contaminants (2020)
Date created: June 5, 2023Tidal waters that are impaired for part or all of the indicated Bay segment by toxic chemicals based on each state's implementation of the Clean Water Act.
View map
Chemical Contaminants (2018)
Date created: February 8, 2022Tidal waters that are impaired for part or all of the indicated Bay segment by toxic chemicals based on each state's implementation of the Clean Water Act.
View map
Chemical Contaminants (2014)
Date created: November 8, 2017Tidal waters that are impaired for part or all of the indicated Bay segment by toxic chemicals based on each state's implementation of the Clean Water Act.
View map
Long-Term Trends for Secchi Disc Depth in the Chesapeake Bay: 1999-2013
Date created: April 30, 2015Long-term trends were computed by state partners using the Seasonal Kendall non-parametric technique for annual data collected from 1999-2013. Highly significant trends are indicated with triangles and possible trends are show with colored circles. Secchi Disk Depth observations (a measure of water clarity) are increasing/improving significantly at 2 stations, possibly increasing at 2 stations, decreasing/degrading significantly at 28 stations, and possibly decreasing at 14 stations.
View map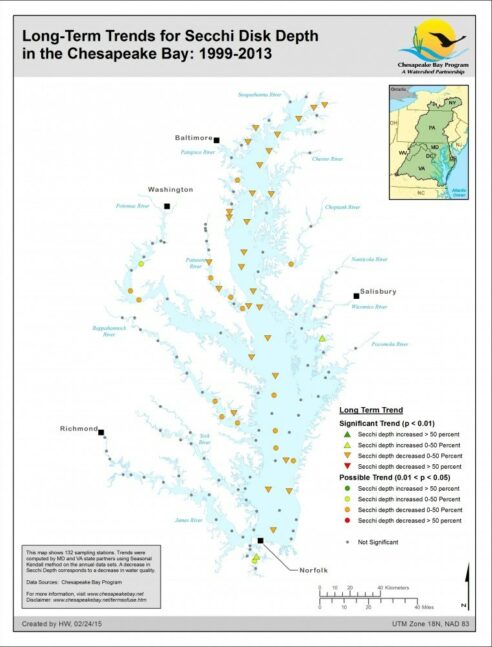
Population (2014)
Date created: April 27, 2015This map shows population estimates within the Chesapeake Bay watershed on a county-by-county basis for the year 2014. For counties not completely within the Chesapeake Bay watershed, the population numbers were derived as a proportion of the total county based on land area.
View map
Short-Term Trend in Flow-Adjusted Total Suspended Solids Concentration, 2004-2013
Date created: January 7, 2015Over the past decade, none of the monitoring sites in the Chesapeake Bay watershed have shown improving flow-adjusted trends in sediment concentrations. Between 2004 and 2013: zero sites have shown improving trends for sediment concentrations. Four sites—including the Appomattox, Choptank, Pamunkey and Patuxent rivers—have shown degrading trends. Five sites—including the James, Mattaponi, Potomac, Rappahannock and Susquehanna rivers—have shown minor changes that are not statistically significant.
View map
Long Term Flow-Adjusted Trends in Sediment, 1985-2013
Date created: January 7, 2015One-third of the monitoring sites in the Chesapeake Bay watershed show improving long-term flow-adjusted trends in suspended sediment concentrations. Between 1985 and 2013: three out of nine sites—including the Choptank, Patuxent and Potomac rivers—have shown improving trends for sediment concentrations. One site—the Pamunkey River—has shown degrading trends. Five sites—including the Appomattox, James, Mattaponi, Rappahannock and Susquehanna rivers—have shown minor changes that are not statistically significant.
View map
Short-Term Trend in Flow-Adjusted Total Phosphorus Concentration, 2004-2013
Date created: January 7, 2015Over the past decade, none of the monitoring sites in the Chesapeake Bay watershed have shown improving flow-adjusted trends in phosphorus concentrations. Between 2004 and 2013: zero sites have shown improving trends for phosphorus concentrations. Two sites—including the Choptank and Susquehanna rivers—have shown degrading trends. Seven sites—including the Appomattox, James, Mattaponi, Pamunkey, Patuxent, Potomac and Rappahannock rivers—have shown minor changes that are not statistically significant.
View map
Long-Term Trend in Flow-Adjusted Total Phosphorus Concentration, 1985-2013
Date created: January 7, 2015One-third of the monitoring sites in the Chesapeake Bay watershed show improving long-term flow-adjusted trends in phosphorus concentrations. Between 1985 and 2013: three out of nine sites—including the James, Patuxent and Potomac rivers—have shown improving trends for phosphorus concentrations. Three sites— including the Appomattox, Choptank and Pamunkey rivers—have shown degrading trends. Three sites—including the Mattaponi, Rappahannock and Susquehanna rivers—have shown minor changes that are not statistically significant.
View map
Short-Term Trend in Flow-Adjusted Total Nitrogen Concentration, 2004-2013
Date created: January 7, 2015Over the past decade, one-third of the monitoring sites in the Chesapeake Bay watershed have shown improving flow-adjusted trends in nitrogen concentrations. Between 2004 and 2013: three out of nine sites—including the Patuxent, Potomac and Susquehanna rivers—have shown improving trends for nitrogen concentrations. One site—the Choptank River—has shown degrading trends. Five sites—including the Appomattox, James, Mattaponi, Rappahannock and Pamunkey rivers—have shown minor changes that are not statistically significant.
View map