Finding out what’s in the water
Scientists track nutrient pollution and measure water quality in the Chesapeake Bay.

Plant forests, issue stormwater permits, install trash traps: the list of things we can do to improve water quality seems to grow each day. And as eager environmentalists, we would love to do all of them as soon as we can. But with worsening water and shrinking budgets, perhaps we should first find out which actions would make the biggest environmental difference.
In order to determine which pollution-reduction solution might work best for ourselves and our community, we must first pinpoint our water problems. Do our waterways contain too much sediment? Too much nitrogen? Once we know these answers, we can determine where to focus our efforts—whether on residential rain gardens that curb stormwater runoff, on upgrades to wastewater treatment plants or on something else entirely.
Finding out what is in our water—or monitoring water quality—provides us with a baseline. After we install a rain garden or restore a forest buffer or complete another restoration project, we can monitor water quality once again to determine whether or not the project has been effective.
How do we monitor water quality?
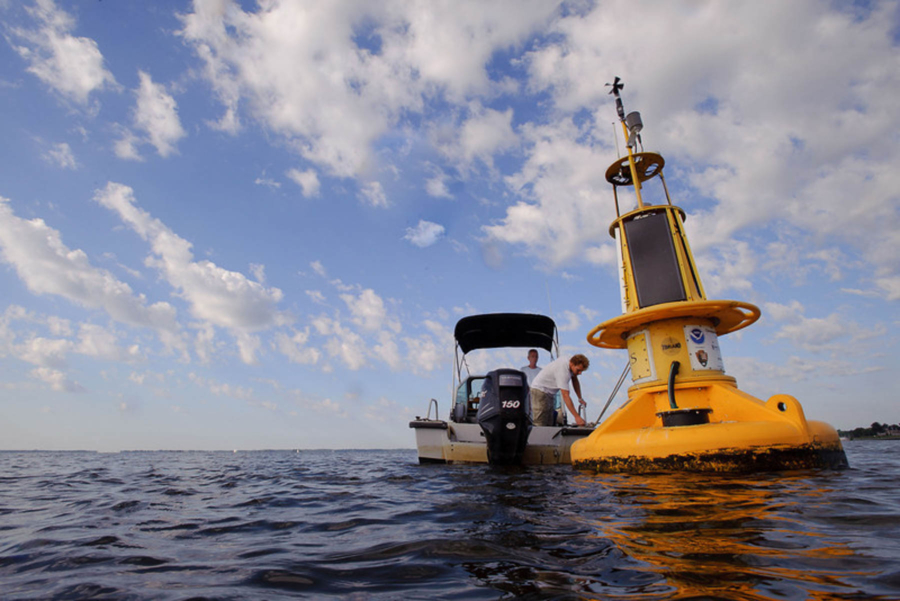
There are multiple ways to monitor water quality. We chose to highlight the method that involves going out on a boat during the summer!
There are two steps: first, biologists from the Maryland Department of Natural Resources (DNR) collect water samples from a number of selected sites throughout the Chesapeake Bay. Then, the samples are analyzed for nitrogen, phosphorus and carbon at the University of Maryland Center for Environmental Science (UMCES).
This analysis paints a vivid picture for scientists, allowing them to see where pollutants come from and how they might be mitigated.
What’s in the water right now?
Due to the lack of rain this year, monitoring teams found fewer nitrates, nutrients that run off into Bay tributaries from fertilizers and soil.
With fewer nitrates, algal blooms were less able to grow and resulting “dead zones” were less able to form. A dead zone is an area that does not contain any oxygen, leaving fish, shellfish and other critters struggling to breathe. This year’s dead zone was nearly half the size of last year’s.
“Nitrates and ammonias… If you have too much of these, it leads to algal blooms, which can lead to dead zones in the Bay,” explains Carl Zimmerman, Manager of the Nutrient Analytical Service Lab at UMCES.
The UMCES lab has multiple ways of analyzing nitrogen, phosphorus and carbon in water samples it receives from field crews.
“We’re looking for changes in the nutrient concentrations. If a best management practice has been implemented, will it improve water quality? Will upgrades in sewage treatment plants reduce the amount of nutrients that come into the Bay? These [answers] can only be accomplished by looking at our water tables,” says Zimmerman.
The DNR monitoring program Eyes on the Bay has a website on which the public can track water quality at each of the Bay’s monitoring sites.
“We want to let the public know how we’re doing as a government in cleaning up the Bay,” explains Mark Trice, Program Chief of DNR's Water Quality Informatics Program.
“We all want a clean Bay and the quality of life that comes with clean water,” says Trice.
More about water quality monitoring:
- You don’t have to be a scientist to monitor water quality. Citizen water quality monitoring programs make it easy for you to see what’s in your local tributary.
- Learn what simple changes you can make to decrease your biggest pollutant (whether it’s nitrogen, phosphorous or sediment), all from your own backyard!
Comments
wonderful
Thank you!
Your comment has been received. Before it can be published, the comment will be reviewed by our team to ensure it adheres with our rules of engagement.
Back to recent stories