Runoff has sent more nitrogen, sediment into Bay than anticipated
New data has given the Chesapeake Bay Program a more accurate picture of pollution in the watershed.
While pollution controls put in place over the last five years have lowered the amount of nutrients and sediment entering the nation’s largest estuary, new data show that agricultural sources have sent more nitrogen and sediment into the Bay since 2007 than previously thought.
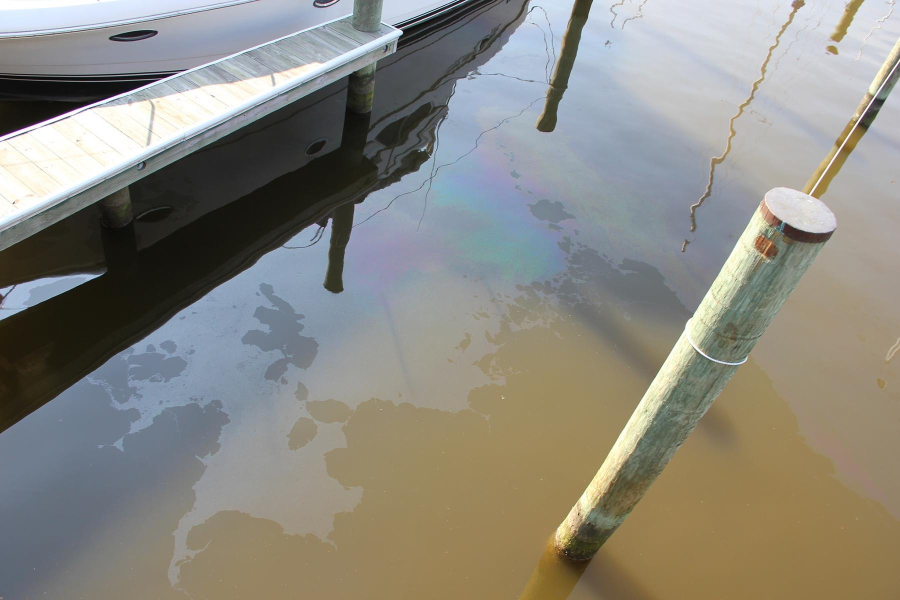
Excess nitrogen, phosphorus and sediment can impair water quality: nitrogen and phosphorus can fuel the growth of harmful algae blooms, while sediment can suffocate shellfish and block sunlight from reaching underwater plants.
Each year, the seven watershed jurisdictions report the steps they have taken to lower the nutrients and sediment entering rivers and streams. Bay Program experts run this information through a suite of computer simulations, which generate pollution load estimates that show us how far our partners have come toward meeting the Bay’s “pollution diet.” When bolstered with new data on population size, land use and agricultural commodities, these simulations show a drop in pollution since 2009—including a six percent drop in nitrogen, an 18 percent drop in phosphorus and a 4 percent drop in sediment—but a two percent rise in nitrogen and sediment loads between 2013 and 2014.
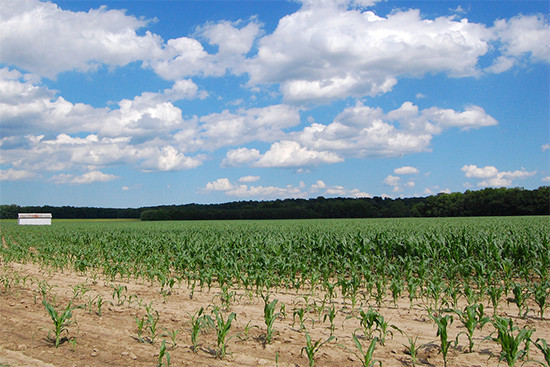
A shift in agricultural commodities could explain this rise in nitrogen and sediment loads. According to data from the U.S. Department of Agriculture’s Census of Agriculture, several states have seen a surge in corn plantings since 2007. Because corn requires nitrogen-rich fertilizer that can leach off the ground and into local waterways, more corn plantings led to more nitrogen loadings than anticipated when pollution targets and reduction milestones were set.
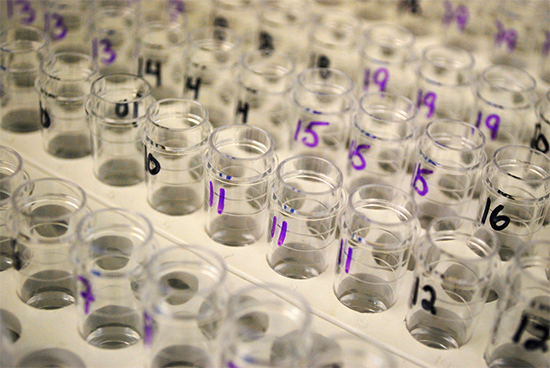
The Bay Program uses the best possible data and information to track our progress toward restoring water quality. By incorporating new data into our computer simulations and pollution load estimates, we are allowed a more accurate picture of pollution in the watershed and a better understanding of the actions that are needed to reach our clean water goals. Because these computer simulations generate pollution load estimates using long-term average weather conditions, it’s possible for these estimates to differ from those that are based on water quality monitoring data; the latter can vary with the amount of rainfall in a given year.
“Each year, we employ the most current data and up-to-date science [to] offer the highest quality information to the public on pollution reductions resulting from Chesapeake Bay Program partners’ continued efforts. While we… have a lot of work to do… we are making steady progress toward meeting water quality goals,” said Bay Program Director Nick DiPasquale in a media release.
These pollution load estimates are just one in a suite of tools the U.S. Environmental Protection Agency (EPA) uses to evaluate whether jurisdictions are on track to meet the Total Maximum Daily Load (TMDL) and its two-year milestone commitments. The EPA also considers data and information on best management practice implementation, best management practice effectiveness and jurisdictions’ progress toward putting programs in place to achieve pollution cuts. It is expected to release interim assessments of jurisdictions’ work in May and conduct the next full two-year assessment in 2016.
Learn more about reducing nitrogen, phosphorus and sediment pollution to the Chesapeake Bay.
Comments
Could poorly maintained Storm Water Management systems be part of the problem for Nitrogen spikes in the Watershed ?
It appears the UNC Chapel Hill is researching 'Nitrogen Fixation'. Nitrogen Fixation occurs when systems designed to remove sediments become Nitrogen Generators. source : http://science.unctv.org/content/video/retention-pond
Gary: Can you provide a link to the monitoring data you are referring to? Thank you. Bill
Pollution controls put in place over the last twenty-five years have lowered the amount of nutrients and sediment entering the nation’s largest estuary. Long-term water quality monitoring data has shown a trend of decreasing sediment and nutrient loading over the last ten-years from the Susquehanna River watershed. While CBP's modeling efforts are sophisticated and constantly being updated, the outputs do not agree with the water quality monitoring data. More resources should be dedicated to local watershed monitoring to truly calibrate the model to reflect the real world.
Thank you!
Your comment has been received. Before it can be published, the comment will be reviewed by our team to ensure it adheres with our rules of engagement.
Back to recent stories