A powerful data set blazes an even more groundbreaking, new trail
Very high-resolution land use and land cover show critical insights about the landscape of the watershed
In December 2016, the Chesapeake Bay Program released what was referred to as “high-resolution land use and land cover data”. At the time, these data were considered “a technological snapshot, the likes of which we’ve never seen before,” according to former Bay Program Director Nick DiPasquale.
Today, the Chesapeake Bay Program is surpassing this milestone by releasing Very High-Resolution Land Cover and Land Use and Change Data. This new tool has three components:
- Updates the original 2013-14 data that was released in 2016.
- Provides brand new land use and land cover data from 2017-18.
- Introduces the first-ever Chesapeake Bay land change tool, that shows how the landscape has transformed between 2013-14 and 2017-18.
Land cover data refers to how much of the landscape is covered by farmland, forests, wetlands, impervious surfaces, and other land and water types. Land use data describes how people use the land—for instance, it could be classified as residential, commercial or industrial. These data are produced directly from either satellite or aerial imagery and combined with information on features picked up from LiDAR imagery and planimetric data on roads and building footprints. Translating land cover data into land use data requires a variety of other types of information including information from tax parcels, active and abandoned mines, golf courses, landfills, utility transmission lines and timber harvest permit areas. Making it even more difficult is that these data vary from state-to-state and county-to-county in how it’s collected.
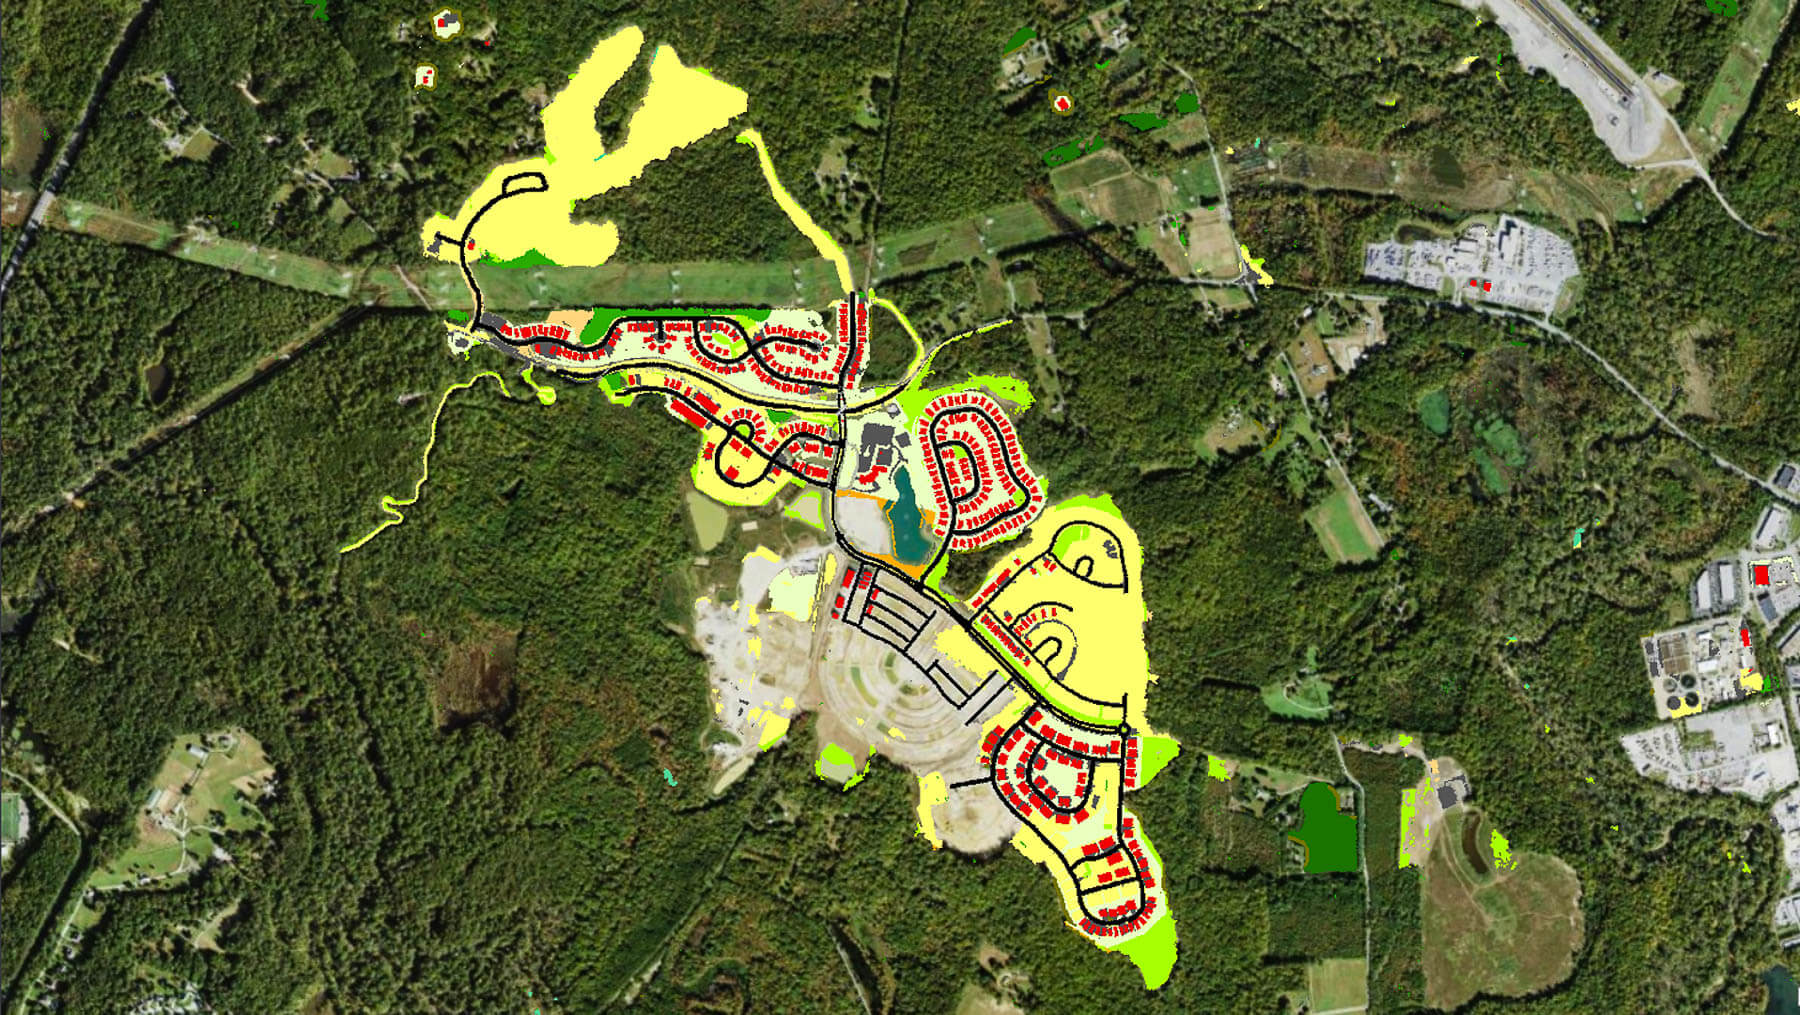
The Very High-Resolution Land Cover and Land Use Data covers an area of 99,000 square miles, encompassing 206 counties that intersect or are adjacent to the Chesapeake Bay watershed. These data can map the land and water at a resolution of one-meter-by-one-meter, providing more precise information about our watershed. For example, previous data might have shown an area of tree cover, but the Very High-Resolution data can show small tracts of woods and individual trees in urban areas.
This tool is especially useful for local and state government staff who are working on plans to reduce their pollution and meet their Chesapeake Bay Total Maximum Daily Load goals. But that’s not the only audience it’s intended for. It supports the 10 goals and 31 outcomes of the Chesapeake Bay Watershed Agreement by helping our partners improve their ability to measure and focus environmental, economic and community benefits, such as determining improvements in air quality, reducing flooding risks, energy savings, carbon sequestration, advancements in environmental justice and enhancements in stormwater management.
The new land change tool complements these two data sets. This tool is the first product in the Chesapeake Bay watershed to map change at such a large-scale. It is the key to understanding how our watershed is transforming, as it tracks how lands are transitioning into developed areas or regions for agricultural production. The land change tool can help guide decisions and actions related to land management goals, including monitoring changes in tree canopy and mapping critical wildlife habitat, ecologically sensitive lands and areas where environmental restoration can provide the most benefit.
The land change tool is currently limited to a 4–5-year span, since the first high-resolution land use and land cover data was only mapped in 2013-14. However, Bay Program experts are using moderate 30-by-30-meter resolution data, produced by the U.S. Geological Survey, to assess long-term changes in land use and land cover. This work is still in progress, and preliminary assessments will be available this summer.
The next iteration of land use and land cover data is expected in 2024, and it will represent the 2021-22 timeframe.
This is the largest amount of open data at this scale that has ever been made available. Did we mention that it’s completely free? To access the data, please visit https://www.chesapeakeconservancy.org/conservation-innovation-center/high-resolution-data/lulc-data-project-2022/.
Comments
Excellent land use data. Having been 16 years with CBPO, we struggled to get this detail for (now 38 years) I do have no idea how we can use it to stop or slow development that has simply continued from my time, which has added over a million people to the basin. Even "wise" or "Sustainable" development adds nails to the Chesapeake's potential coffin.
I still maintain a data base where I live on a Bay Tribitary after more than four decades, and regrettably it shows decline rather than rejuvenation. I commend you people carrying on traditions that Rich Batiuk and I espoused from our earliest days at the Program..
Thank you!
Your comment has been received. Before it can be published, the comment will be reviewed by our team to ensure it adheres with our rules of engagement.
Back to recent stories