Relief from the heat: In rapidly warming cities, trees can save lives
Melting ice caps, rising sea levels, increasingly tenacious hurricanes and regular flooding have dominated the news cycle around climate change and its effects. But another consequence of our changing climate has been felt for years, particularly in our country’s inner-city neighborhoods, with an annual death toll that exceeds all other weather-related events combined. The urban heat island effect—when land and air temperatures are higher in urban areas due to an abundance of paved surfaces that absorb and radiate heat—is just starting to get the widespread attention it deserves.
Every decade of the past 50 years has been hotter than the last, and 2020 is already breaking records for not only the severity, but also the duration of its heat waves. As new research sheds light on the scope, increasing intensity and nature of heat islands, historic inequities are being newly scrutinized, highlighting the integral importance of environmental justice in cities’ climate change adaptation strategies.
Because of land use practices that exacerbate the urban heat island effect, such high levels of concrete and paved surfaces, low levels of vegetation, and other heat-concentrating factors, metropolitan areas warm at roughly twice the rate of non-urban areas. But there is still a large degree of variability amongst cities and their neighborhoods. Up until now, when a heat wave occurred, public health concerns centered on the most vulnerable and elderly populations without access to air conditioning. But new research and information has widened our scope of understanding heat-related impacts by exploring the relationship between historic urban planning practices and how different neighborhoods experience extreme heat.
Why are some city neighborhoods hotter than others?
The Fair Housing Act of 1968 banned the practice of redlining—a tactic used to segregate entire neighborhoods by refusing home loans or insurance to applicants of color—but its legacy of restricting Black and Brown home ownership to one area and white, above-average income households to other, safer areas, continues to persist today, leading to inequitable distributions of economic opportunities, public services and amenities. A study recently published by the journal Climate analyzed temperature variations across 108 urban areas to see if there were any significant modern implications of these historic housing practices. There were, and they were astounding: the researchers found that land surface temperatures in redlined areas are approximately 4.7°F warmer than non-redlined neighborhoods during the summer. And as these average temperatures continue to rise, so too do the heat-related deaths.
These findings add perspective and context to a growing body of research illustrating how neighborhoods with less greenspace and tree canopy are hotter on average than their greener counterparts, and that this disparity neatly correlates with the racial and socioeconomic make-up of neighborhoods.
Heat disparity research in the Chesapeake Bay Watershed
Some of the first cities to map their hot spots and assess heat disparities are right here in the Chesapeake Bay watershed. In Richmond, Virginia, a NOAA-funded campaign enabled Dr. Jeremy Hoffman and Dr. Eugene Maurakis of the Science Museum of Virginia to recruit citizen-scientists from several local schools and grassroots organizations to help with research. On a hot day in July of 2017, these volunteers traversed through the city in cars and on bikes equipped with devices designed to mark location, air temperature and time.
The results showed differences of up to 16°F across neighborhoods during the hottest part of the day. Mapping the data also helps researchers correlate ambient air temperatures with other data, such as tree canopy coverage, income levels and amounts of impervious cover, thus providing a clearer picture of the areas of the city most at risk, and why.
“It was really this community-powered campaign that started it all,” says Hoffman, “Our nonprofit partners helped connect the dots between their lived experiences and the data we were sharing with them. It has put our City on the trajectory toward shade equity.”
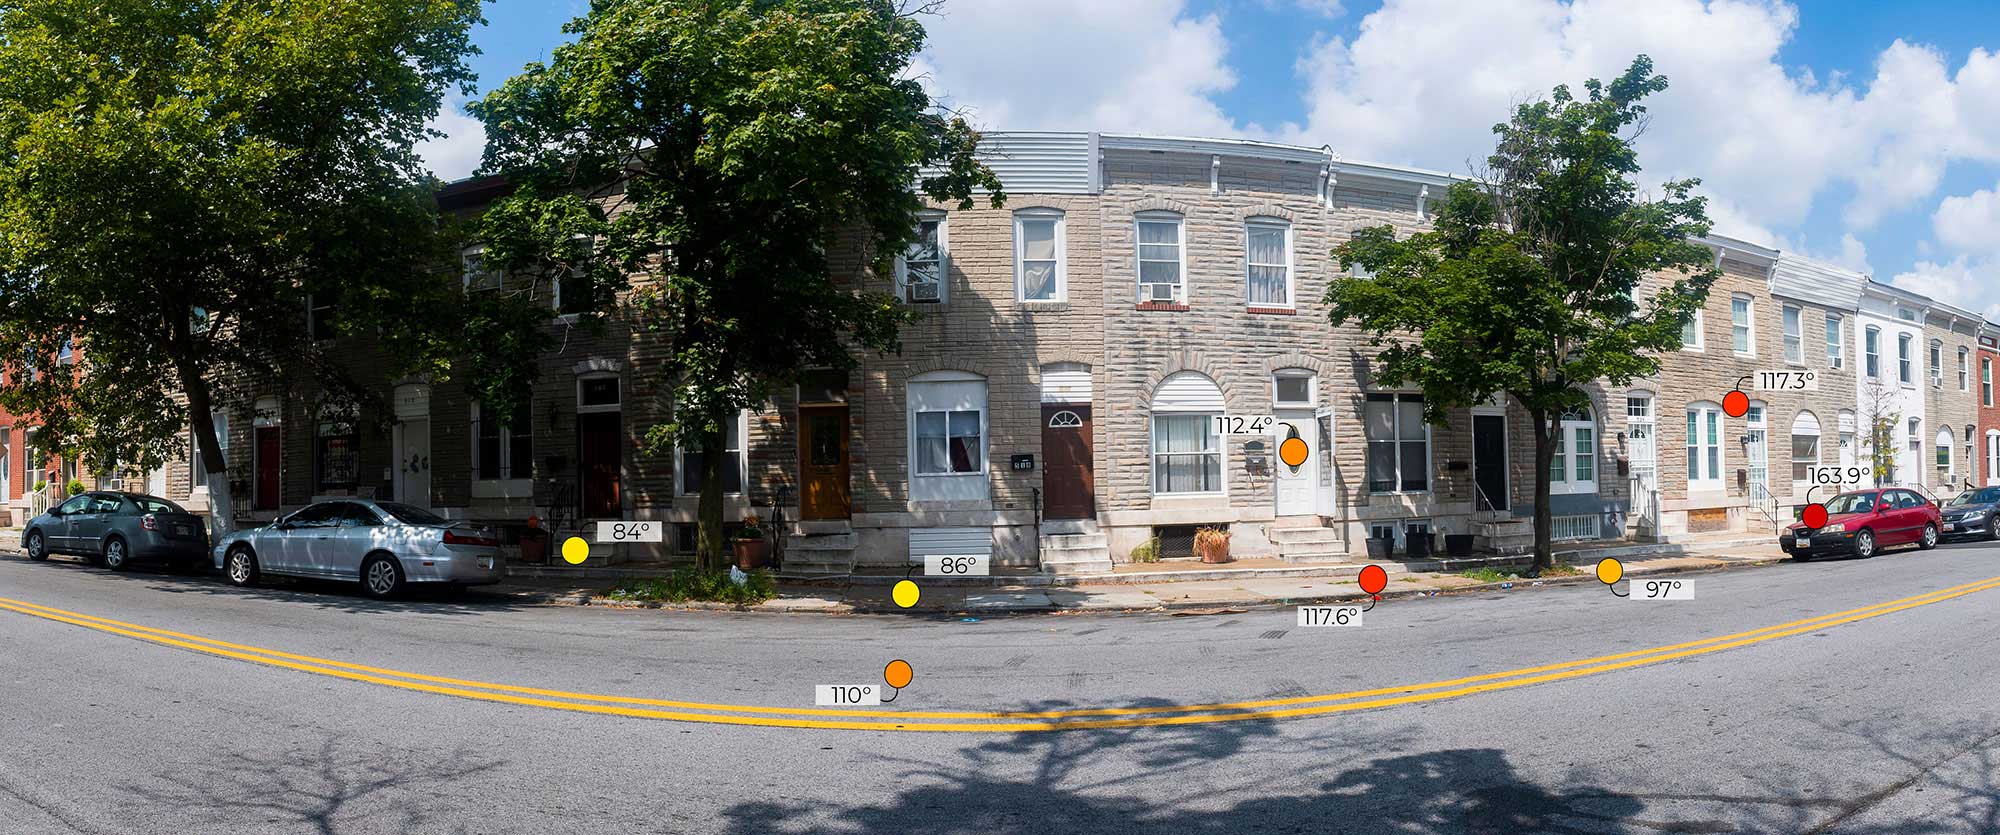
In Baltimore, Md., average annual temperatures over the last hundred years have increased at nearly twice the rate as the rest of country. Researchers now estimate the number of dangerously hot days—or—“Code Red” days—could increase six-fold by 2050. In the summer of 2019, reporters from the University of Maryland’s Howard Center for Investigative Journalism and Capital News Service placed heat sensors inside several homes in Baltimore’s poorest neighborhoods, which recorded temperatures as high as 97°F and a heat index of 119 °F. In some instances, cooler temperatures were recorded outside of the homes. Twelve Code Red days were declared by the health department by the beginning of August.
In temperature readings taken by researchers at Portland State University in Oregon and the Science Museum of Virginia on one particularly hot day in August 2018, there was an 16°F difference between the coolest neighborhood in the city, which has 40% tree canopy coverage, and the hottest neighborhoods in the city, which has a tree canopy coverage of only 10%.
Reducing the impact of urban heat islands
Urban heat islands and their effects are now, without any doubt, an equity issue, and cities working to mitigate its effects must concentrate their efforts in low-income communities, which have borne the brunt of not only increased exposure from living in deserts made of asphalt, concrete and metal, but also historic disinvestment in public amenities, like trees and greenspace, that have proven to reduce and mitigate myriad urban stressors. Across every major US city, the same patterns have been established: people who live in the hottest and least canopied parts of the city are more likely to be poor, experience higher rates of unemployment and violent crime, and struggle with higher rates of chronic illnesses.
Increased availability and accessibility of public cooling centers, such as shaded parks and recreational facilities, is not a long term solution, as the duration of heat waves can go on for weeks on end, and many have to walk through 100°F weather in order to get to one. Exponential increases in energy use associated with air conditioning only exacerbate the greenhouse effect, further contributing to climate change.
The combination of increased tree cover and reflective surfaces remain the most effective measures to counter this downward spiral and must be viewed as pivotal infrastructure investments—requirements for the health and wellbeing of all neighborhoods.
Looking at the certainty of more extreme heat events begs the question of how else cities and governments can integrate such threats into their emergency planning repertoires. “Can we name heat waves like we name hurricanes, and even have them recognized as the natural disasters they are by Federal Emergency Management Association and other planning agencies?” asks Shandas. “Issues of diversity, equity and inclusion are still left out of conversations around mitigation planning on the national level, but these are disasters that we can plan for.”
This article is within a series from the Chesapeake Tree Canopy Network, including Planting for the Climate of the Future: Washington, D.C.’s Efforts to Counter Urban Heat Islands
Comments
There are no comments.
Thank you!
Your comment has been received. Before it can be published, the comment will be reviewed by our team to ensure it adheres with our rules of engagement.
Back to recent stories