The Bay Program revamps the Chesapeake Healthy Watershed Assessment
Explore conditions across the watershed with this updated tool
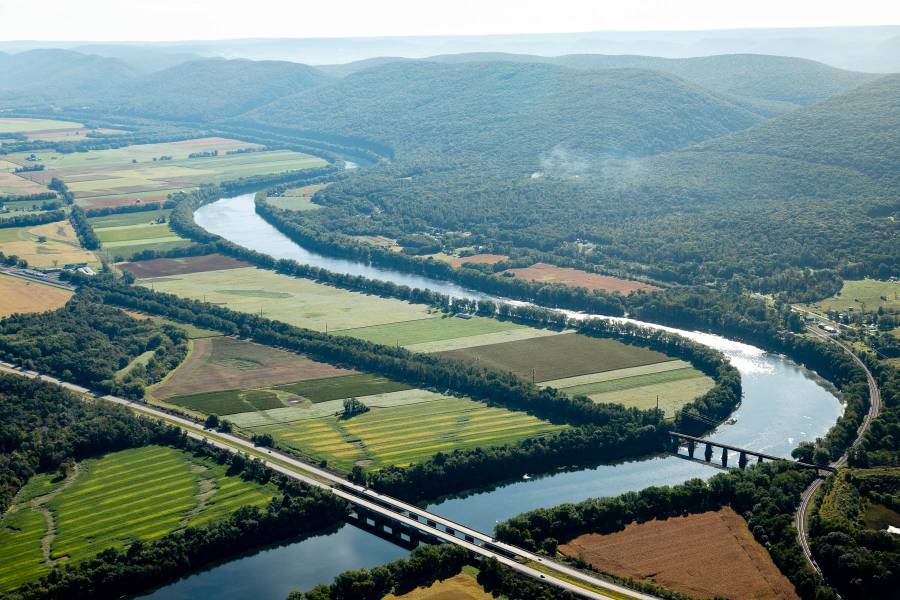
The Chesapeake Bay watershed spans over 64,00 square miles, but within that watershed are thousands of smaller sub-watersheds where rainfall and snowmelt drain from the land into rivers, streams and lakes. Last year, Chesapeake Bay Program partners released an update of the Chesapeake Healthy Watersheds Assessment (CHWA 2.0), an interactive tool containing over 100 environmental metrics related to 83,628 of these sub-watersheds.
Building off and improving upon previous models, the CHWA 2.0 includes data related to the landscape, biology, hydrology, habitat, geomorphology and the general health of Chesapeake watersheds. Scientists and environmental leaders from around the region can use the tool to explore what’s happening in their specific watershed, keeping an eye on its vulnerability and health, which leads to better-informed strategies for conservation and restoration.
What’s in the CHWA 2.0?
One of the key layers within CHWA 2.0 is the predicted Chesapeake Benthic Index of Biotic Integrity (Chessie BIBI) score, which ranks watersheds as having “good”, “fair” or “poor” health. Chessie BIBI is essentially a report card assessing the micro and macroinvertebrate life living in a stream, which is one way of determining how healthy the ecosystem is. We used this data to predict health scores across the watershed and found that roughly 65% of the watersheds are healthy, meaning they are either “good” or “fair”. The remaining 35% of the watersheds are predicted to be poor.
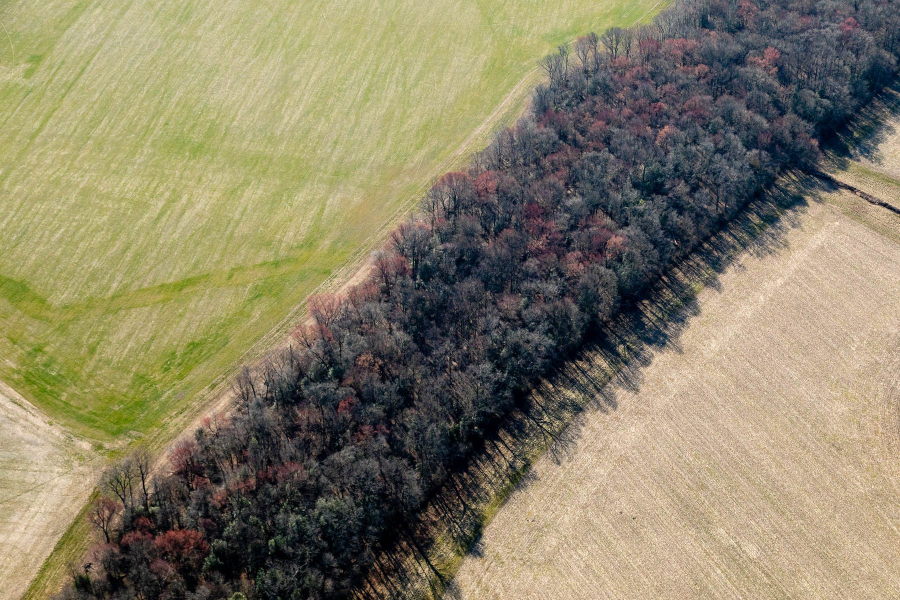
CHWA 2.0 includes several other data layers related to a watershed’s health. Some of these include the percentage of tree cover in riparian areas, climate stresses such as changes in stream temperature and the percentage of impervious surface cover such as building, roads and parking lots, just to name a few. Data layers such as these allow users to explore landscape conditions around a particular watershed to better understand its health and where stresses may be coming from.
How we predicted the healthy watershed scores
While the predicted Chessie BIBI scores gives us an excellent idea of how healthy a watershed is, unfortunately, it’s not available for all 83,628 subwatersheds. This means we needed to estimate the remaining scores to rank the watersheds as good, fair or poor.
To do this, we used a machine learning algorithm known as a random forest model. Random forest models combine the outputs of various “decision trees” to reach a single result (essentially, combining multiple datasets to predict a new dataset). In this case, we used the existing Chessie BIBI data as one decision tree, and combined it with other information related to landscape, biology, hydrology, etc., to estimate Chessie BIBI scores for all the watersheds.
Our random forest had an overall accuracy score of 59%. Twenty-nine percent of the error came from the “fair” category. In several of the watersheds, the algorithm was unable to determine a watershed’s health with complete accuracy due to a lack of information, including pollution levels and the practices in place to lower them.
However, CHWA 2.0 has helped us identify which metrics performed best at predicting watershed health. According to our research, these metrics include:
- Percent of forest in the upstream watershed.
- Percent of natural lands in the upstream watershed (forests and wetlands).
- Percent of impervious lands in the upstream watershed (i.e. roads, structures, parking lots, etc.).
- Housing density in the upstream watershed (i.e. housing units per area).
- Road density in the upstream watershed (i.e. road area per total area).
How you can use the tool
Local governments, riverkeepers and other organizations can use CHWA 2.0 to better understand what’s happening in their water.
The online tool can serve as an early warning sign if watersheds start to degrade, help identify areas that are more resilient or vulnerable to climate change impacts and provide supporting information for strategies to protect and maintain watershed health. Users can download the information sheets about watersheds of interest our contact the Maintain Healthy Watersheds Goal Implementation Team for any questions.
The tool will continue to be updated with new data, likely increasing the overall accuracy, to give practitioners a better understanding of each sub-watershed’s health and its impact on the Chesapeake Bay.
Comments
There are no comments.
Thank you!
Your comment has been received. Before it can be published, the comment will be reviewed by our team to ensure it adheres with our rules of engagement.
Back to recent stories