Maps
Browse through maps depicting Bay health and restoration, including pollution trends, public access sites and more.
Long-Term Trends for Secchi Disc Depth in the Chesapeake Bay: 1999-2013
Date created: April 30, 2015Long-term trends were computed by state partners using the Seasonal Kendall non-parametric technique for annual data collected from 1999-2013. Highly significant trends are indicated with triangles and possible trends are show with colored circles. Secchi Disk Depth observations (a measure of water clarity) are increasing/improving significantly at 2 stations, possibly increasing at 2 stations, decreasing/degrading significantly at 28 stations, and possibly decreasing at 14 stations.
View map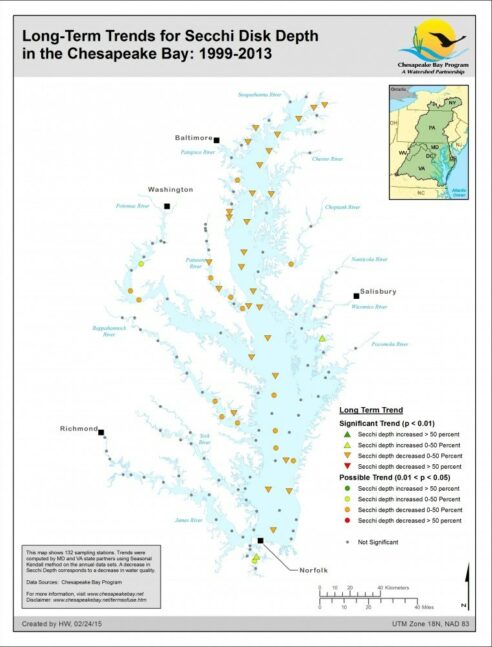
Long-Term Trends for Bottom Orthophosphate in the Chesapeake Bay: 1999-2013
Date created: April 30, 2015Long-term trends were computed by state partners using the Seasonal Kendall non-parametric technique for annual data collected from 1999-2013. Highly significant trends are indicated with triangles and possible trends are show with colored circles. Bottom Orthophosphate concentrations are decreasing/improving significantly at 21 stations, possibly decreasing at 7 stations, increasing/degrading significantly at 6 stations, and possibly increasing at 3 stations.
View map
Long-Term Trends for Bottom Total Phosphorus in the Chesapeake Bay: 1999-2013
Date created: April 30, 2015Long-term trends were computed by state partners using the Seasonal Kendall non-parametric technique for annual data collected from 1999-2013. Highly significant trends are indicated with triangles and possible trends are show with colored circles. Bottom total phosphorus concentrations are decreasing/improving significantly at 27 stations, possibly decreasing at 13 stations, increasing/degrading significantly at 12 stations, and possibly increasing at 10 stations.
View map
2014 Public Access
Date created: April 28, 2015Existing public access sites in the Chesapeake Bay watershed as reported by state partners through 2014. Sites added in 2014 are depicted in orange, while sites existing before 2014 are blue.
View map
Long-Term Trends for Bottom Total Nitrogen in the Chesapeake Bay: 1999-2013
Date created: April 28, 2015Long-term trends were computed by state partners using the Seasonal Kendall non-parametric technique for annual data collected from 1999-2013. Highly significant trends are indicated with triangles and possible trends are show with colored circles. Bottom total nitrogen concentrations are decreasing/improving significantly at 31 stations, possibly decreasing at 15 stations, and increasing/degrading significantly at 1 station.
View map
Long-Term Trends for Surface Total Phosphorus in the Chesapeake Bay: 1999-2013
Date created: April 28, 2015Long-term trends were computed by state partners using the Seasonal Kendall non-parametric technique for annual data collected from 1999-2013. Highly significant trends are indicated with triangles and possible trends are show with colored circles. Surface total phosphorus concentrations are decreasing/improving significantly at 36 stations, possibly decreasing at 23 stations, increasing/degrading significantly at 2 stations, and possibly increasing at 6 stations.
View map
Long-Term Trends for Surface Orthophosphate in the Chesapeake Bay: 1999-2013
Date created: April 28, 2015Long-term trends were computed by state partners using the Seasonal Kendall non-parametric technique for annual data collected from 1999-2013. Highly significant trends are indicated with triangles and possible trends are show with colored circles. Surface Orthophosphate concentrations are decreasing/improving significantly at 29 stations, possibly decreasing at 7 stations, increasing/degrading significantly at 5 stations, and possibly increasing at 2 stations.
View map
Long-Term Trends for Surface Total Nitrogen in the Chesapeake Bay: 1999-2013
Date created: April 28, 2015Long-term trends were computed by state partners using the Seasonal Kendall non-parametric technique for annual data collected from 1999-2013. Highly significant trends are indicated with triangles and possible trends are show with colored circles. Surface total nitrogen concentrations are decreasing/improving significantly at 41 stations, possibly decreasing at 16 stations, increasing/degrading significantly at 1 station, and possibly increasing at 1 station.
View map
Long-Term Trends for Surface Chlorophyll-a in the Chesapeake Bay: 1999-2013
Date created: April 28, 2015Long-term trends were computed by state partners using the Seasonal Kendall non-parametric technique for annual data collected from 1999-2013. Highly significant trends are indicated with triangles and possible trends are show with colored circles. Surface chlorophyll-a concentrations are decreasing/improving significantly at 2 stations, possibly decreasing at 7 stations, increasing/degrading significantly at 25 stations, and possibly increasing at 16 stations.
View map
Population (2014)
Date created: April 27, 2015This map shows population estimates within the Chesapeake Bay watershed on a county-by-county basis for the year 2014. For counties not completely within the Chesapeake Bay watershed, the population numbers were derived as a proportion of the total county based on land area.
View map