Maps
Browse through maps depicting Bay health and restoration, including pollution trends, public access sites and more.
Delivered Yield of Total Phosphorus - All Sources
Date created: February 13, 2008This map shows the Delivered yield (load per area) of Total Phosphorus from all sources. Delivered yield is the amount of nutrient that is generated locally for each stream reach and weighted by the amount of in-stream loss that would occur with transport from the reach to Chesapeake Bay. The cumulative loss of nutrients from generation to delivery to the Bay is dependent on the travel time and instream-loss rate of each individual reach. This map shows estimates of Total Nitrogen based on mean conditions for the late 1990's time period using the SPARROW model from USGS. SPARROW, or SPAtially Referenced Regressions On Watershed (SPARROW) attributes, uses a nonlinear regression approach to spatially relate nutrient sources and watershed characteristics to nutrient loads of streams throughout the Chesapeake Bay watershed.
View map
Chesapeake Bay Airshed
Date created: February 7, 2008This map depicts the Airshed that is used for Chesapeake Bay modeling purposes. The Airshed Model (Regional Acid Deposition Model - RADM) tracks nitrogen emissions from all sources in the airshed. The model is three-dimensional; it simulates movement both vertically and horizontally across a region. The Airshed Model covers the eastern United States from Texas and North Dakota eastward to Maine and Florida with 22,000 cells. Each cell measures eighty kilometers square. Stacked up, the cells make fifteen vertical layers reaching about fifteen kilometers high. The airborne nutrient loads are transported by the Airshed Model and linked to the Watershed Model through deposition to land surfaces and to the Estuary Model through deposition to the water surfaces of the tidal Bay.
View map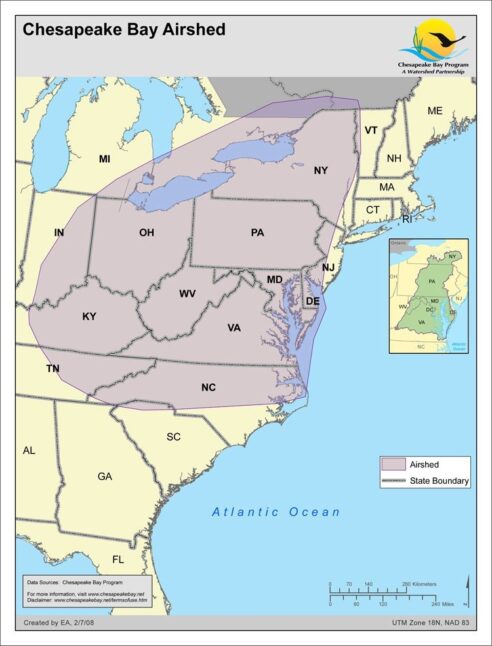
Chesapeake Bay Watershed Model: Phase 5 Modeling Segments
Date created: January 17, 2008n order to divide the model domain into county based land segments, a finer segmented river reach network and associated watersheds.This data set is an ArcGIS shapefile depicting land segments in the Chesapeake Bay Watershed and adjacent states of New York, Pennsylvania, Maryland, West Virginia, Delaware, Virginia as well as North Carolina and Tennessee (not shown). Land segmentation was based on county boundaries represented by a 1:100,000-scale digital dataset. Fifty of the 254 counties and incorporated cities in the model region were divided on the basis of physiography and topography, producing a total of 310 land segments. The data are projected to the UTM grid coordinate system - Zone 18 NAD83. Land and watersheds segments were intersected to create land-watershed segments for the model. The land segments are to be used with the Chesapeake Bay Regional Watershed Model to represent the county political boundaries and areas of differing physiography and topography in the study area.
View map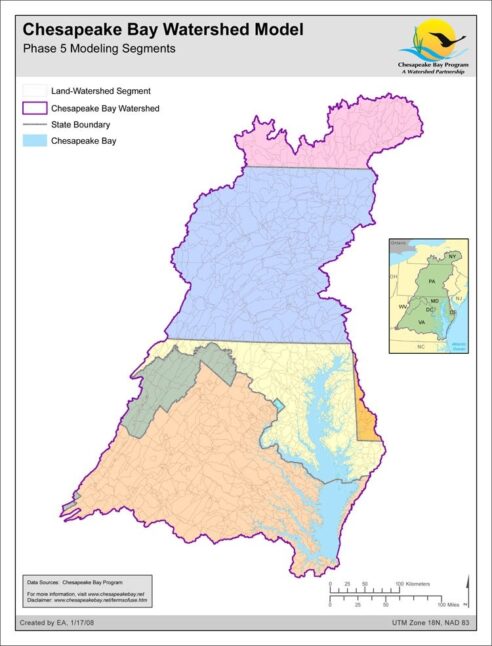
Chesapeake Bay Watershed Model: Phase 4.3 Modeling Segments
Date created: January 17, 2008Final 2003 Phase 4.3 Chesapeake Bay Watershed Model Segments. The intersection of counties found in the study are roughly 8-digit HUC sized watersheds used in conjunction with the HSPF based Phase 4.3 Chesapeake Bay Watershed Model for simulation of nutrient and sediment delivery to the tidal waters of the Chesapeake Bay.
View map