Connecting modeling and monitoring at the watershed level
New Chesapeake Bay Program tool enhances understanding of data collected at non-tidal monitoring stations

The Chesapeake Bay Program uses a variety of tools to understand the health of the Chesapeake Bay. Unfortunately, no one method can give us the full picture of how restoration actions are contributing to a cleaner Bay.
A robust partnership network of 123 non-tidal monitoring stations, which includes nine River Input Monitoring stations, give our experts an idea of the amount of nitrogen, phosphorus and sediment that is carried by the rivers and streams that make up the Chesapeake watershed. While these monitoring stations are physically showing us what is in our waterways, each water sample is only providing us with information for one moment at a given time.
When combined together in the Chesapeake Assessment Scenario Tool (CAST), the information collected from these monitoring stations, along with data about land use, septic systems, agricultural practices, wastewater treatment plants and more, give experts a more complete understanding of the Bay’s health and what is impacting it.
The History of the Chesapeake's Pollution Reduction Activities
The Chesapeake Bay Program specifically works to reduce nitrogen, phosphorus and sediment pollution from entering the Chesapeake from its 64,000-square-mile watershed, because the first studies into the degradation of the estuary in the 1970s found these three pollutants to be the driver for the Bay’s poor health.
The Chesapeake Bay Total Maximum Daily Load (Bay TMDL) was established in 2010 to identify the maximum amount of nitrogen, phosphorus and sediment pollution that could enter the Chesapeake Bay and still meet healthy standards for water quality. Each of the seven jurisdictions in the watershed–Delaware, the District of Columbia, Maryland, New York, Pennsylvania, Virginia and West Virginia–have unique targets they strive to meet to reduce these pollutants.
The seven watershed jurisdictions install and maintain best management practices (BMPs) to help reduce pollution and meet their individual Bay TMDL targets. The roadmap for installing these BMPs, including where, when and how many, are included in each of the jurisdictions’ Watershed Implementation Plan (WIPs).
Over the past decade, the Bay TMDL pollutant reduction targets have been updated to account for changing environmental conditions, variations in land use, lag times and the Conowingo Dam reservoir reaching sediment trapping capacity. To help further bridge the gap between CAST and monitoring data, in 2024, the Chesapeake Bay Program introduced the Bay TMDL Indicator. The Bay TMDL Indicator estimates how reductions in nitrogen and phosphorus pollution have responded to installed BMPs and other watershed changes as mentioned above.
Introducing METRIC
Now, the partnership continues to enhance our understanding of the health of the Chesapeake Bay with the Monitored and Expected Total Reduction Indicator for the Chesapeake, or METRIC Tool. The METRIC Tool specifically looks at the non-tidal monitoring stations across the watershed to determine if what we are seeing in the data we collect matches what we think we should be seeing, according to our partnership models.
METRIC is particularly useful in helping determine how installed BMPs and other watershed changes (like land use) are impacting the reduction of nitrogen, phosphorus and sediment at the local level. At the moment, the METRIC Tool has comparisons of modeled and monitored nitrogen data for 83 non-tidal monitoring stations, and modeled and monitored phosphorus and sediment data for 66 non-tidal monitoring stations. And it’s free to use!
What METRIC Shows
When you access the METRIC Tool, you first see a map showing each of the non-tidal monitoring network stations across the watershed that have analyzed data available. For the purposes of this example, we’ll use the Conestoga monitoring station along the Conestoga River in Lancaster County, Pennsylvania.
The first thing you see on the screen are the controls you use to interact with METRIC, along with a map of the included monitoring stations, where you can find information about individual stations. This information includes where the station is located and what major tributary it feeds into. In this case, it’s the Susquehanna River, the largest water source flowing into the Chesapeake Bay. Next, it looks like you can check out data analyses here for nitrogen, phosphorus and sediment. For now, we’ll focus on nitrogen.
I can look at progress over time for this monitoring station, as well as download raw data sets. But what I'm really interested in falls under the ‘Progress’ tab.
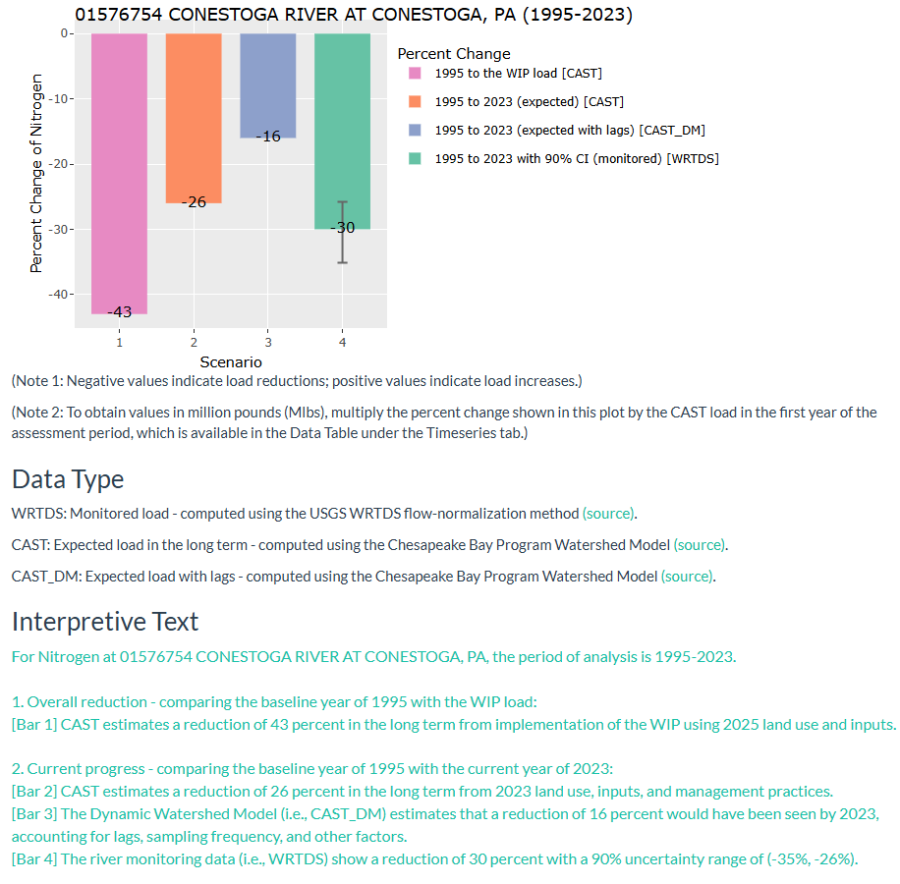
Let’s concentrate on the colors in the above chart. The furthest bar on the left, which is pink, indicates how much nitrogen pollution Pennsylvania planned to be reduced at this monitoring station in their WIP, which is 43% from 1995–2023.
The next bar, which is orange, shows how much nitrogen is estimated to have been reduced at the Conestoga monitoring station from 1995–2020. The estimate of 26% is based on the information that is entered into CAST each year, which tracks the progress that Pennsylvania is making toward meeting their Bay TMDL targets.
The blue bar on the graph adjusts the estimate of the orange bar by taking into account the data reported for CAST, the monitored data collected at the station and other factors, such as land use changes, lag time and changing environmental conditions. This bar shows that nitrogen is estimated to have decreased here by 16% over the same time period. However, the monitoring data, which is the final green bar on the graph, shows that nitrogen is estimated to have decreased here by 30%, which is actually much better than expected!
We envision this information will be of greatest use to state and local land use planners but anyone is welcome to visit the METRIC Tool to better understand what the water quality is looking like in their local area. You can access the METRIC Tool at https://wqs.chesapeakebay.net/metric/.
Comments
There are no comments.
Thank you!
Your comment has been received. Before it can be published, the comment will be reviewed by our team to ensure it adheres with our rules of engagement.
Back to recent stories