Lasers and satellites help us map the Chesapeake watershed
How remote sensing is used in Chesapeake Bay restoration
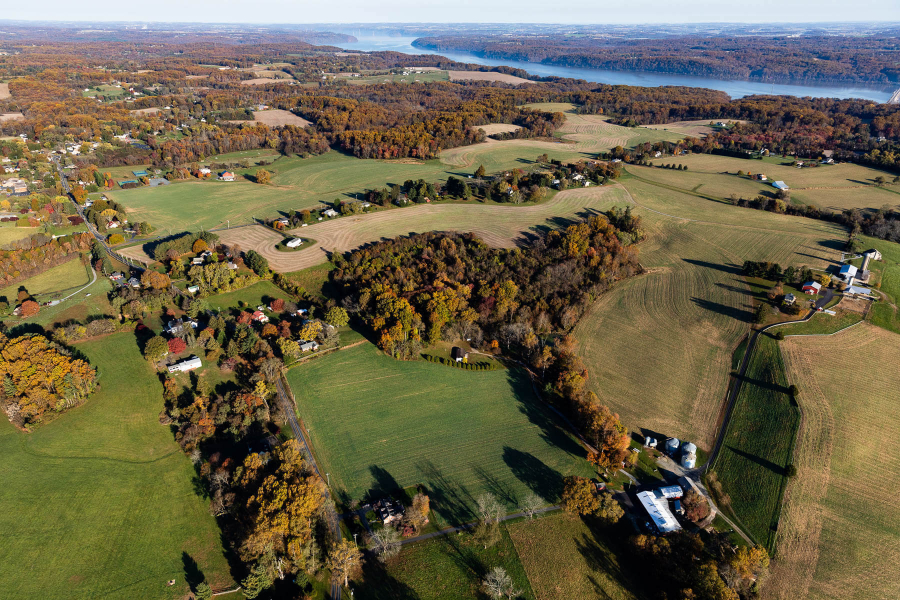
While the Chesapeake Bay itself is about 200 miles long, the area of land and water that drain into it spans 64,000 square miles and touches six different states and all of the District of Columbia. This 14:1 land-to-water ratio is the largest of any coastal water body in the world.
What this means is that when planning and evaluating the type of projects that help keep Chesapeake waters clean, like planting trees, restoring oyster reefs or reducing runoff, we have a ton of land to consider. Knowing how that land is being used and how it has changed over time is a critical part of improving water quality in and around the Bay.
There are various ways we collect these data, but one of the most affordable and efficient ways is through remote sensing. Instead of taking pictures of what’s on the ground, one way remote sensing works is by using special sensors placed on satellites and planes that pick up on the waves of energy being reflected from objects below.
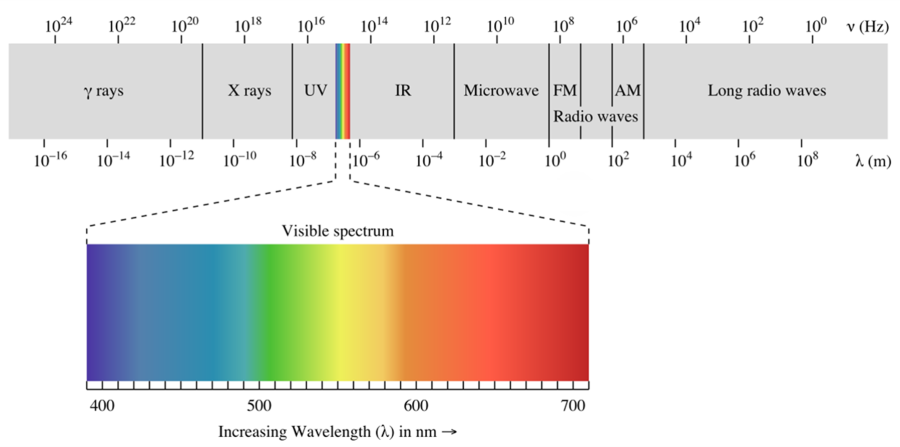
All objects, whether natural or manmade, reflect energy from the sun that can be measured on the electromagnetic spectrum (seen below). Only a small range of the energy along the electromagnetic spectrum is visible to the human eye (e.g., light emanating from a lamp); the sensors described above detect other portions we cannot see.
In remote sensing, ranges of the electromagnetic spectrum are referred to as “bands,” and each object will emit a different band with varying intensity. For example, vegetation, such as trees or plants, reflect light strongly in the “near infrared” band of the electromagnetic spectrum (labeled IR in the below figure). Other objects, like buildings and parking lots, reflect other ranges of the spectrum.
So, if a sensor detects high values of reflected light from the near-infrared band, it is likely the area being measured contains healthy vegetation.
Often, we have to combine these data with information collected through other forms of remote sensing. The above example is known as “passive” remote sensing, because the sensors are collecting energy generated by the sun and reflected from an object, but there is also “active” remote sensing in which a sensor generates its own energy to provide data about objects.
One example of an active sensor is Light Detection and Ranging (LiDAR), which works by rapidly emitting lasers from the sensor, often being flown in an aircraft, and measuring the time it takes for the laser to hit objects on the ground and then bounce back.
Accounting for variables like the speed and location of the aircraft and knowing the constant value for the speed of light at which the laser pulse travels, one can determine the 3-D outline of the surface being mapped. For example, the time it takes for the laser to travel out and back can tell us if something is a tree, bush or grass because those objects have different heights.
Like a data puzzle, this information is combined with the passive remotely sensed data described above to determine if the object is actually a tree or just a building of similar height.
All of this technology has allowed the Bay Program to produce tools like the Very High Resolution Land Cover/Land Use dataset, which maps the lands and waters of the watershed at a very precise one-meter-by-one-meter scale. Given the large size of the watershed, this publicly available imagery is unmatched across the United States.
You might be wondering how exactly this information helps us protect the Bay. Using vegetation as an example, the healthier or denser a forest is, the better it is at keeping nearby waterways clean. So if we can determine characteristics of forests across the watershed, we can have a better idea of where restoration is most needed. This is the same for other land uses—such as farms or housing developments—that have their own specific impact on local waterways.
Remote sensing can also be used to better understand the impacts of sea level rise. At the Bay Program, we use LiDAR to determine where sea level rise is expected to flood and threaten wetlands, which are critical to the health of the Bay and its wildlife. As wetlands flood, they will have to “migrate” inland. If state officials know where this is likely to occur, they can make sure there’s enough room for these wetlands to migrate.
The next time you see a satellite dotting the night sky, remember that it might be helping us restore the Bay.
Comments
Very nice!
Very good article and great work. I am digitizing the Bay area for fun. I look forward to looking at your data to see if my suspicions are correct; human impact on the environment- good and bad. Thanks for the information.
Thank you!
Your comment has been received. Before it can be published, the comment will be reviewed by our team to ensure it adheres with our rules of engagement.
Back to recent stories