Chesapeake Bay Program releases 2018-19 Bay Barometer
Chesapeake Bay Program releases 2018-19 Bay Barometer
Today, the Chesapeake Bay Program released its annual report, Bay Barometer: Health and Restoration in the Chesapeake Bay Watershed 2018-19. This science-based snapshot provides the most up-to-date information about the environmental health and restoration of the Chesapeake Bay watershed. These data and information are the result of the efforts of the many Chesapeake Bay Program partners and inform different individuals and organizations across the watershed.
The Chesapeake Bay Program is a regional partnership of federal, state and local governments, academic institutions and non-governmental organizations that lead and direct the restoration and protection of the Chesapeake Bay and it’s 64,000 square mile watershed. Guided by the Chesapeake Bay Watershed Agreement, Chesapeake Bay Program partners use 10 interrelated goals and 31 outcomes to collectively advance the protection and restoration of the Chesapeake Bay ecosystem.
Many of these outcomes have related indicators, targets and deadlines that allow the Chesapeake Bay Program to track progress toward environmental restoration, protection and stewardship. Data and information used to track this progress come from a range of trusted sources, including government agencies, academic institutions, nongovernmental organizations and direct demographic and behavior surveys.
Abundant Life
Determining the health of the Chesapeake Bay is as complex as the ecosystem itself. Across the watershed, rainfall, temperature and other conditions vary from month to month and year to year, which impacts the surrounding environment. Extreme weather conditions in 2018 affected Bay health in 2019. Record rainfall led to the highest amount of freshwater flows entering the Bay since monitoring began in 1937, leading to lower salinity levels in parts of the Bay and contributing to the largest observed dead zone in the past five years.
“Extreme weather events, including record high freshwater flows, usually have a negative impact on the Bay’s living resources,” said Scott Phillips, Chesapeake Bay coordinator, U.S. Geological Survey and co-chair, Chesapeake Bay Program Scientific, Technical Assessment and Reporting Team. “However, while the record river flow, and associated nutrients, contributed to worsening dissolved-oxygen conditions, underwater grasses held steady and blue crab populations increased. The collective restoration efforts being carried out by the Chesapeake Bay Program are improving the ecosystem and making it more resilient to extreme weather events.”
Highlights:
- Blue Crab Abundance: The 2019 Bay-wide winter dredge survey suggests the population of blue crabs increased nearly 60%, from 372 million in 2018 to 594 million in 2019.
- Blue Crab Management: According to the Chesapeake Bay Stock Assessment Committee, an estimated 23% of the female blue crab population was harvested in 2018. For the 11th consecutive year, this number is below the 25.5% target and the 34% overfishing threshold. Therefore, the Chesapeake Bay blue crab population is not considered depleted or overfished.
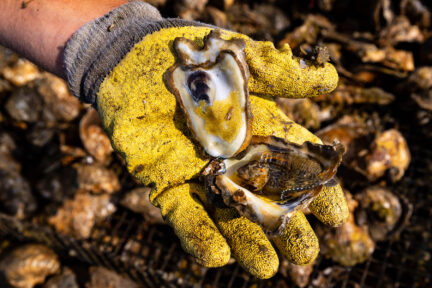
- Oysters: During the summer of 2019, Maryland selected the Manokin River as the tenth and final tributary for large-scale oyster restoration, joining four other sites in Maryland and five in Virginia. According to the 2018 Maryland Oyster Restoration Update, 773 acres of oyster reefs have been restored in the Choptank Complex—which includes Harris Creek, the Little Choptank River and the Tred Avon River—and 510 acres of oyster reefs have been restored in Virginia, with reef construction and seeding in the Lafayette River now complete.
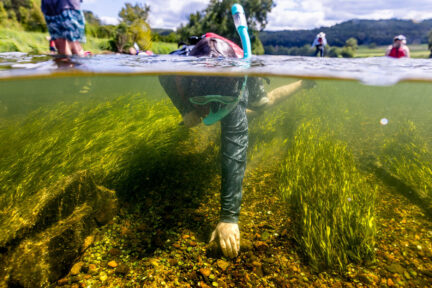
- Underwater Grasses (Submerged Aquatic Vegetation, or SAV): In 2018, an estimated 91,559 acres of underwater grasses were mapped in the Chesapeake Bay and its tidal tributaries. While this acreage is less than the previous year, it is likely that substantially more underwater grasses grew in the Bay and its tidal tributaries than the mapped acreage suggests. Frequent rain, cloudy water and security restrictions prevented researchers from successfully collecting aerial imagery over 22% of the Bay. Researchers are working to supplement this aerial imagery with satellite imagery to ascertain a better estimate of the grasses in 2018. Using 2017 levels for the unmapped areas, it’s possible that the Bay may have supported up to 108,960 acres of underwater grasses in 2018, which would have been a four percent increase from 2017 figures and 59% of the partnership’s 185,000-acre goal.
Clean Water
In 2019, the Chesapeake Bay Program took a big step forward in improving the water quality of the Chesapeake Bay and local waterways. Each of the seven Chesapeake Bay watershed jurisdictions submitted their Phase III Watershed Implementation Plans (WIPs), which detail how they plan to meet their pollutant reduction goals set by the Chesapeake Bay Total Maximum Daily Load. These actions will help ensure Bay water quality is healthy enough for the plant and aquatic species that depend on it for survival (e.g. blue crabs, oysters, underwater grasses).
“The role of land conservation, forest cover and public engagement easily gets lost in the challenges of nutrient reductions and program agreements,” said Cindy Adams Dunn, secretary of the Pennsylvania Department of Conservation and Natural Resources. “Yet when we look at solutions for our conservation challenges, this work emerges as critical--riparian buffers, conserved forest land, and green infrastructure will play a big role in addressing the bay ecosystem’s resiliency and pollution absorbing capacity.”
Highlights
- Protected Lands: According to data collected through early 2019, nearly 1.36 million acres of land in the Chesapeake Bay watershed have been permanently protected since 2010. This marks an achievement of 68% of the land conservation goal adopted in the Chesapeake Bay Watershed Agreement and brings the total amount of protected land in the watershed to 9.16 million acres.
- Watershed Implementation Plans: During the period 2017-2018, pollution reducing practices are in place across the Chesapeake Bay watershed to achieve 39% of the nitrogen reductions and 77% of the phosphorus reductions necessary to attain applicable water quality standards as compared to the 2009 baseline established under the Bay TMDL. For the short-term, 55% of these nitrogen load reductions came from the agricultural sector. Pollution controls put in place between 2009 and 2018 have lowered nitrogen loads by 10% and phosphorus loads by 13%, which can mainly be attributed to upgrades to wastewater treatment plants.
Engaged Communities
The long-term success of the Bay restoration effort depends on the individuals and organizations that live, work and play in the region. The Chesapeake Bay Program supports environmental stewardship in all forms: increasing public access to the water, expanding the environmental literacy of all students, engaging underserved communities, increasing the diversity of those working on environmental issues and expanding the ability of local government leaders to promote restoration activities.
“Think globally, act locally, when practiced by Bay jurisdictions, is exactly what it takes to improve water quality in Chesapeake Bay and its tributaries,” said Penny Gross, member of the Chesapeake Bay Program’s Local Government Advisory Committee. “When local governments and their residents and businesses take the appropriate steps to clean up local streams and waterways, returning them to fishable and swimmable sites, the positive effect on the Bay is measurable. Small, specific steps turn into giant leaps, but there is much more to be done, and local governments are leading the way.”
Highlights:
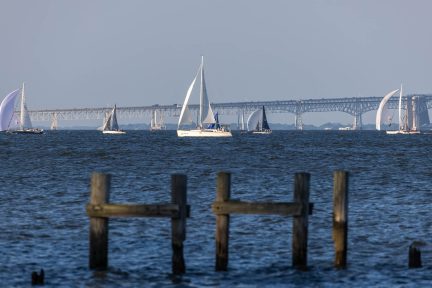
- Public Access: Between 2010 and 2018, 176 boat ramps, fishing piers and other public access sites were opened on and around the Chesapeake Bay. This marks a 59% achievement of the goal to add 300 new access sites to the watershed by 2025 and brings the total number of access sites in the region to 1,315.
The data found in the Bay Barometer reflect the health of the Chesapeake Bay watershed over the course of many years, and in some cases, decades. The publication offers a snapshot of the best available information from 2018 and 2019 on ecological health and our efforts to protect and restore the nation’s largest estuary. The most up-to-date indicators can be viewed on ChesapeakeProgress as soon as they are available. ChesapeakeProgress is the Chesapeake Bay Program’s one-stop shop for the most current information on the progress made toward the goals and outcomes of the Chesapeake Bay Watershed Agreement.
Recent Press Releases
Annual Chesapeake Bay Awareness Week celebrates a watershed “Built by Nature, Protected Together”
A mild dead zone is expected for the Chesapeake Bay this summer
Chesapeake Bay Program Provides Final Snapshot of Progress Under 2014 Watershed Agreement