Tier I: Chesapeake Bay-wide Aerial Survey
The Chesapeake Bay-Wide Aerial SAV Survey is a long-standing monitoring effort coordinated through the Chesapeake Bay Program
What is the Chesapeake Bay-wide Aerial Survey?
The Chesapeake Bay-wide Aerial survey is an annual aerial image gathering and assessment effort to determine the distribution and density of SAV in the Bay and its tidal tributaries. The effort is led by the Virginia Institute of Marine Science (VIMS) and is supported by the Chesapeake Bay Program and additional state and federal partners. It is the first tier of the Chesapeake Bay SAV Monitoring effort.
How does it work?
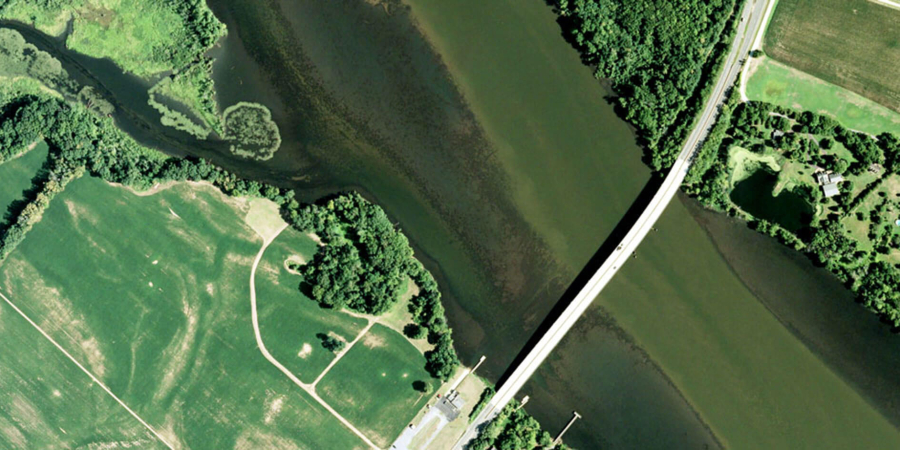
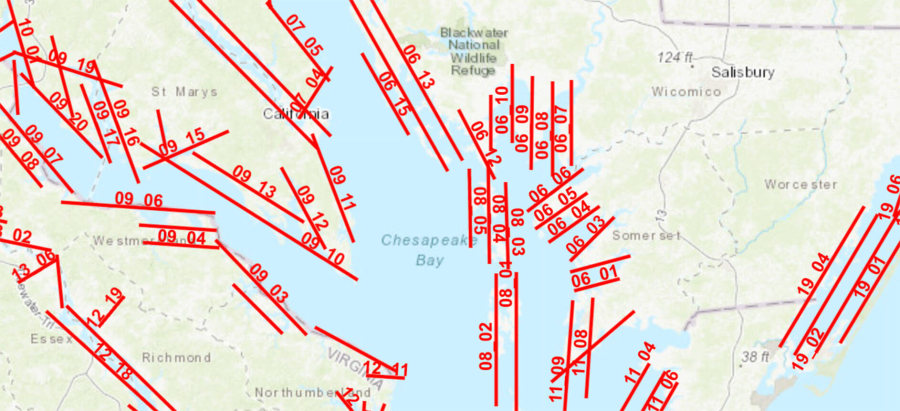
Conducted each year by VIMS, the survey involves flying an airplane outfitted with a multispectral digital mapping camera and an inertial measurement unit (IMU) over designated flight lines to obtain imagery. Flight lines are positioned in areas known to be inhabited by SAV and in areas where SAV may be expected to occur. Flights are prioritized for areas of significant SAV coverage and are timed to occur during the peak biomass of the SAV species known to inhabit the area. Guidelines for aerial imagery acquisition are strict; conditions (e.g., tidal stage, plant growth, sun angle, turbidity and wind) need to be nearly optimal for SAV detection.
How is the imagery used?
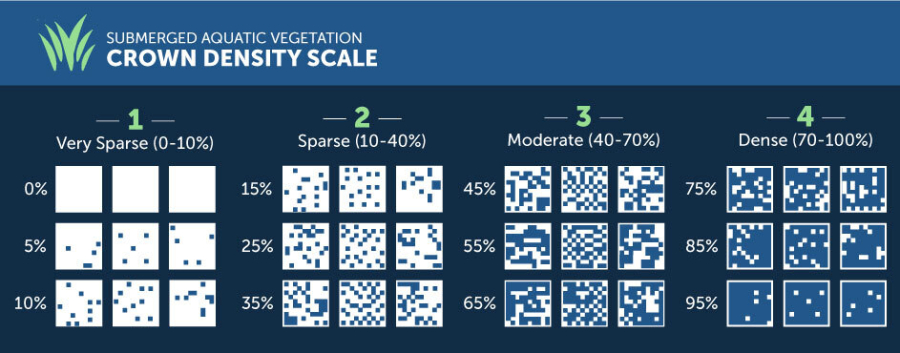
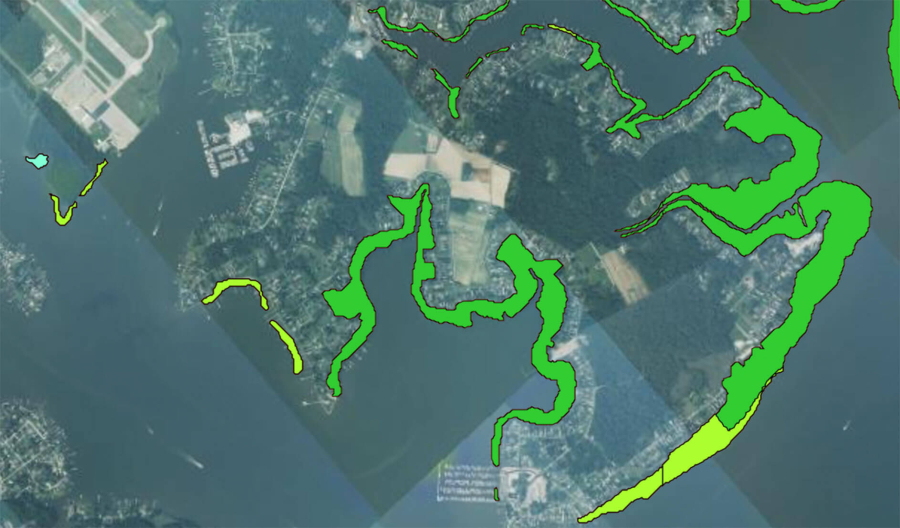
Once obtained, the digital aerial imagery is visually examined to identify SAV beds. Images of areas with SAV present are georectified and orthographically corrected (a process that flattens out terrain and aligns the imagery to a coordinate system) to create a seamless image mosaic for the Bay. From these mosaics, outlines of SAV beds are hand-drawn and delineated using GIS software. SAV density within the beds is estimated into four classes: 1 (<10% coverage); 2 (10-40% coverage); 3 (40-70% coverage); or 4 (70-100% coverage), by comparing the image to a crown density scale (see Figure 2). Information from supplemental ground surveys, including the SAV Watchers program, is tabulated and entered into the GIS data. Area for all SAV beds is then calculated and reported.
SAV distribution data are organized according to the Chesapeake Bay Program’s Segmentation Scheme. 93 segments throughout the Bay grouped into four salinity zones: tidal fresh (<0.5 ppt); oligohaline (0.5-5 ppt), mesohaline (5-18 ppt), and polyhaline (18-25 ppt). These data are used to produce annual reports, tables, charts, and an interactive map that are available on the VIMS website.
Aerial Survey Reports and Data
The following reports, charts and tables are on annual SAV density and coverage throughout the Chesapeake Bay.
Interactive SAV Map
Visualized Chesapeake Bay SAV distribution data can be accessed through an interactive map hosted on the VIMS website. The map enables users to display many different SAV data and resources from 1971 to present day, including:
- SAV species
- Bed densities
- Bed outlines
- Flight lines
- SAV Imagery
- Long-term composite outlines
- Comparison of years
- Orthorectified imagery
- Segment specific, historical SAV fact sheets
The visualization of this data allows resource managers to track, compare and analyze change in SAV distribution in specific locations over time throughout the Bay. It is a useful tool for SAV restoration site planning activities and for watershed organizations engaged in local-scale monitoring and a necessary tool for permitting and regulatory requirements.
Bay-wide SAV Survey funders
The following state and federal agencies provide funding to the Bay-Wide Aerial SAV Survey.