Experts Consider Chesapeake Bay an Ecosystem in Recovery
Experts Consider Chesapeake Bay an Ecosystem in Recovery
The Chesapeake Bay Program’s summary analysis of Chesapeake Bay health reveals an ecosystem in recovery. Released today, Bay Barometer offers a science-based snapshot of environmental health and restoration in a watershed that faces daily challenges from development and pollution.
While communities across the watershed have continued to take important steps to reduce the nutrient and sediment pollution that has long plagued the Chesapeake, the Bay remains impaired. Scientists have long understood that our actions on the land will not show immediate improvements in water quality, so a lack of significant change in water quality monitoring data over the past decade is not a surprise. Nevertheless, some living resources are showing signs of resilience. Despite a sizeable drop in the abundance of blue crabs, underwater grass acreage has risen 24 percent, American shad have continued to return to Potomac River spawning grounds and the relative abundance of young striped bass in both Maryland and Virginia waters has recovered from the low numbers seen in 2012.
Resilience is a quality we see every year in the vast network of waters and lands that make up the Bay watershed. As the parts of this ecosystem shift, we use scientific data and information—presented in the indicators seen here—to track the success of our work to protect the natural world. Such consistent scientific exploration and monitoring provides the basis for our path forward in restoring, conserving and protecting the Bay and in achieving the ground-breaking goals and outcomes of the Chesapeake Bay Watershed Agreement.
Facts
Highlights from the latest edition of Bay Barometer can be found below.
Signs of Resilience
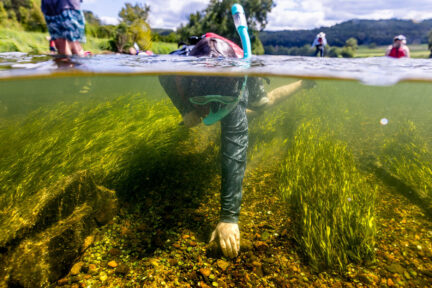
- Between 2012 and 2013, the abundance of underwater grasses in the Bay rose 24 percent. Scientists observed 59,927 acres of underwater grasses in the Bay and attribute the increase to an expansion in widgeon grass and a modest recovery of eelgrass.
- In 2013, the abundance of American shad in the watershed increased to 41 percent of the goal. The Bay-wide trend was driven by rising shad abundance in the Potomac and York rivers.
- Between 2013 and 2014, the relative abundance of juvenile striped bass in the Bay increased. Index values in Maryland and Virginia are about equal to historic values for each state, and are a significant increase from the low numbers seen in the region in 2012.
Signs of Impairment
- Between 2011 and 2013, 29 percent of the water quality standards for dissolved oxygen, water clarity or underwater grasses and chlorophyll a for the Bay and its tidal tributaries were attained. These results are not significantly different from those of the previous three-year assessment period.
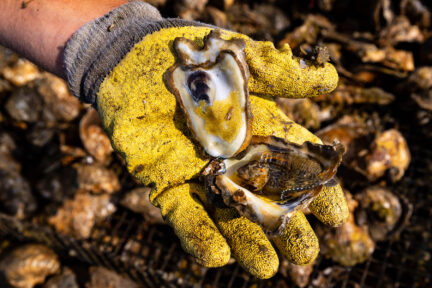
- Between 2013 and 2014, the abundance of spawning-age female blue crabs in the Bay fell 53 percent, from 147 million to 68.5 million. This number is below the 215 million target and the 70 million threshold, which means adult female crabs are in a depleted state.
Reducing Pollution
- Between 2009 and 2013, modeling estimates show that our partners have reduced 20.28 million pounds of nitrogen, 2.04 million pounds of phosphorous and 497 million pounds of sediment. This means that nitrogen loads to the Bay fell 7 percent, phosphorous loads fell 11 percent and sediment loads fell 6 percent.
Restoring the Watershed
- Since 1989, 2,576 miles of fish passage have been restored to rivers and streams.
- Since 1996, 7,994 miles of trees and shrubs have been planted along rivers and streams.
- Between 2010 and 2013, 6,098 acres of wetlands were established, rehabilitated or reestablished on agricultural lands.
- 8,371,682 acres of land have been permanently protected from development.
- 1,208 public access sites have been established across the watershed.
Issues
Determining the health of the Chesapeake Bay is as complex as the ecosystem itself. Across the watershed, rainfall, temperature and other conditions change from month to month and year to year, impacting the surrounding environment. Human activities also impact the air, land and water, as we consume resources and clear the land to suit our needs. Tracking changes in environmental health over time gives scientists a better understanding of both natural variations and the long-term effects of our restoration work. In Bay Barometer, we offer our data in their clearest form so you can assess the health of our ecosystem and the progress we are making toward restoring it.
Importance
The data in Bay Barometer reflect the Chesapeake Bay’s health over the course of many years and, in some cases, decades. The publication offers a snapshot of the best available information from 2013 and 2014 on ecological health and our efforts to protect and restore the nation’s largest estuary.
Quotes
“The Chesapeake Bay watershed is a vast and complex ecosystem that faces continued challenges. Human activities bring more roads, parking lots and rooftops that have a direct impact on water quality and living resources. These also contribute to the impacts of climate change: rising sea levels, warmer stream temperatures and increasing strength and frequency of storms. Yet in the face of these constantly changing challenges, we are witnessing signs of a system in recovery. And people have the ability to positively affect and help in the recovery process. In fact, we must do so. Bay Program science continually monitors impacts and changes in the watershed, giving us information that helps us adapt our responses. It is then up to us and our communities to redouble our efforts, overcome these challenges and restore the Bay’s ecosystem.”
--- Nick DiPasquale, Director, Chesapeake Bay Program
Recent Press Releases
Annual Chesapeake Bay Awareness Week celebrates a watershed “Built by Nature, Protected Together”
A mild dead zone is expected for the Chesapeake Bay this summer
Chesapeake Bay Program Provides Final Snapshot of Progress Under 2014 Watershed Agreement