Underwater Bay Grasses Decrease by 6,239 Acres in Chesapeake Bay and Rivers in 2010
Underwater Bay Grasses Decrease by 6,239 Acres in Chesapeake Bay and Rivers in 2010
Underwater grasses covered 79,675 acres of the Chesapeake Bay and its tidal rivers in 2010, a decrease of 6239 acres from the previous year. This represents about 43 percent of the 185,000-acre baywide abundance goal, according to data from scientists with the Chesapeake Bay Program. Despite being a 7 percent decrease from 85,914 acres in 2009, these most recent estimates still rank as the 3rd highest baywide acreage since 1984, when the Virginia Institute of Marine Science (VIMS) began conducting its annual aerial survey.
“We were pleased that grasses remain healthy and abundant in two areas where nutrient pollution was reduced: the upper Potomac River and Susquehanna Flats,” said Bob Orth, scientist with the Virginia Institute of Marine Science and leader of the baywide annual survey. “However, the overall condition for bay grasses remains one of concern with many areas still having few, if any, grass beds. In 2010, our big concern arose in the lower Bay where eelgrass appeared to suffer another setback from the incredibly hot summertime temperatures. Since we had mapped those beds prior to the heat wave, losses there are not reflected in our final figures.”
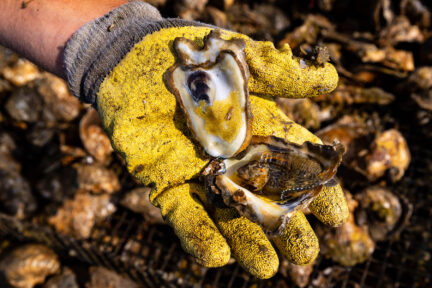
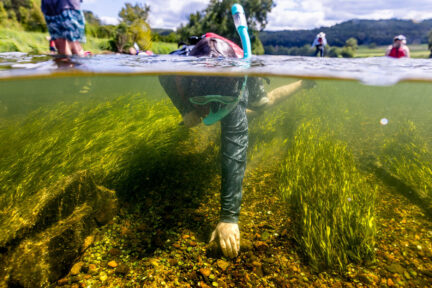
Bay grasses -- also called submerged aquatic vegetation (SAV) -- are critical to the Bay ecosystem. They provide habitat and nursery grounds for fish and blue crabs, serve as food for animals such as turtles and waterfowl, clear the water by reducing wave action, absorb excess nutrients and reduce shoreline erosion. They are also an excellent measure of the Bay's overall condition because their health is closely linked to water quality. Annual acreage of grasses is estimated through an aerial survey, which is flown from late spring to early fall.
Orth continued, “We believe the really hot summer temperatures in the early part of the growing season may have just cooked the grasses before we were able to map them, e.g. parts of the Honga River. The changes also occurred in areas dominated by just one species, widgeongrass, which has been shown to be a boom or bust species. 2010 may have been the hottest on record but it was those summer time temperatures in June that may have tipped the scale for SAV in some areas.”
Grass Numbers by the Zones
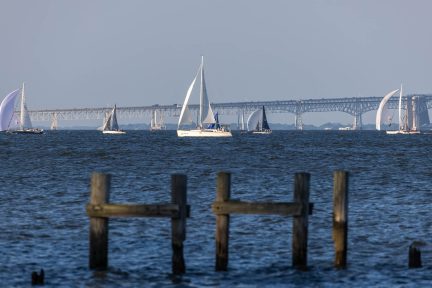
- Upper Bay: In the upper Bay zone (from the Chesapeake Bay Bridge north), bay grasses covered about 21,353 acres (or about 90% of the 23,630-acre goal for this zone) which is a 10 percent decrease from 2009. Large percentage increases were observed in the Chesapeake and Delaware Canal and part of the Sassafras River. However, bay grass acreage in a few local rivers, such as the Bush, Bohemia and Magothy, decreased significantly and offset increases elsewhere. Overall, the massive grass bed on the Susquehanna Flats, often observable on daily satellite pictures continues to dominate this zone.
- Mid-Bay: In the middle Bay zone (from the Chesapeake Bay Bridge to the Potomac River and Pocomoke Sound), bay grass acreage decreased 11 percent to 35,446 acres, 31 percent of the 115,229-acre goal. Most areas declined in this zone, with the largest percentage declines occurring in the middle and lower Central Chesapeake Bay, as well as the Choptank, Honga, Patuxent and Potomac Rivers. Increases in bay grasses were seen in Tangier and Pocomoke Sounds and the Manokin and Big Annemessex Rivers, as eelgrass continued it’s resurgence following a 2005 die-off.
- Lower Bay: In the lower Bay zone (south of the Potomac River), researchers found 22,876 acres of bay grasses – a 1 percent increase from 2009 and almost 50 percent of the 46,030-acre restoration goal. This is the fourth year that bay grasses in the lower Bay zone have increased since 2005, when hot summer temperatures caused a dramatic large-scale dieback of eelgrass. Most of the gains were in the Upper Rappahannock, lower Piankatank, the mouth of the James and the upper James Rivers, offsetting losses in other areas of the zone.
Annual bay grass acreage estimates are an indication of the Bay's response to pollution control efforts, such as implementation of agricultural best management practices (BMPs) and upgrades to wastewater treatment plants. Homeowners throughout the Bay region help bay grasses and overall water quality by using landscaping techniques that keep excess nutrients from flowing downstream where they can harm nearby streams and eventually the Bay. Local watershed groups and online resources such as CBP’s “Plant More Plants” campaign – plantmoreplants.com – can offer people more information on how to get started.
”Even with the decreases in the 2010 bay grass coverage, the patterns are similar to previous years,” said Lee Karrh, living resources assessment chief with the Maryland Department of Natural Resources and chair of the Bay Program's SAV Workgroup. “Many of the fresh and low salinity areas have very high abundances, including sixteen that have reached their restoration targets, However, the saltier parts of the Bay continue to struggle, with most areas well below the restoration goals, with only the mouth of the James River exceeding the goal.”
For additional information about the aerial survey and an interactive map of SAV acreage throughout the Chesapeake Bay, visit www.vims.edu/bio/sav/. For more information about the status of underwater bay grasses in the Chesapeake Bay, visit www.chesapeakebay.net/status_baygrasses.aspx.
Recent Press Releases
Annual Chesapeake Bay Awareness Week celebrates a watershed “Built by Nature, Protected Together”
A mild dead zone is expected for the Chesapeake Bay this summer
Chesapeake Bay Program Provides Final Snapshot of Progress Under 2014 Watershed Agreement